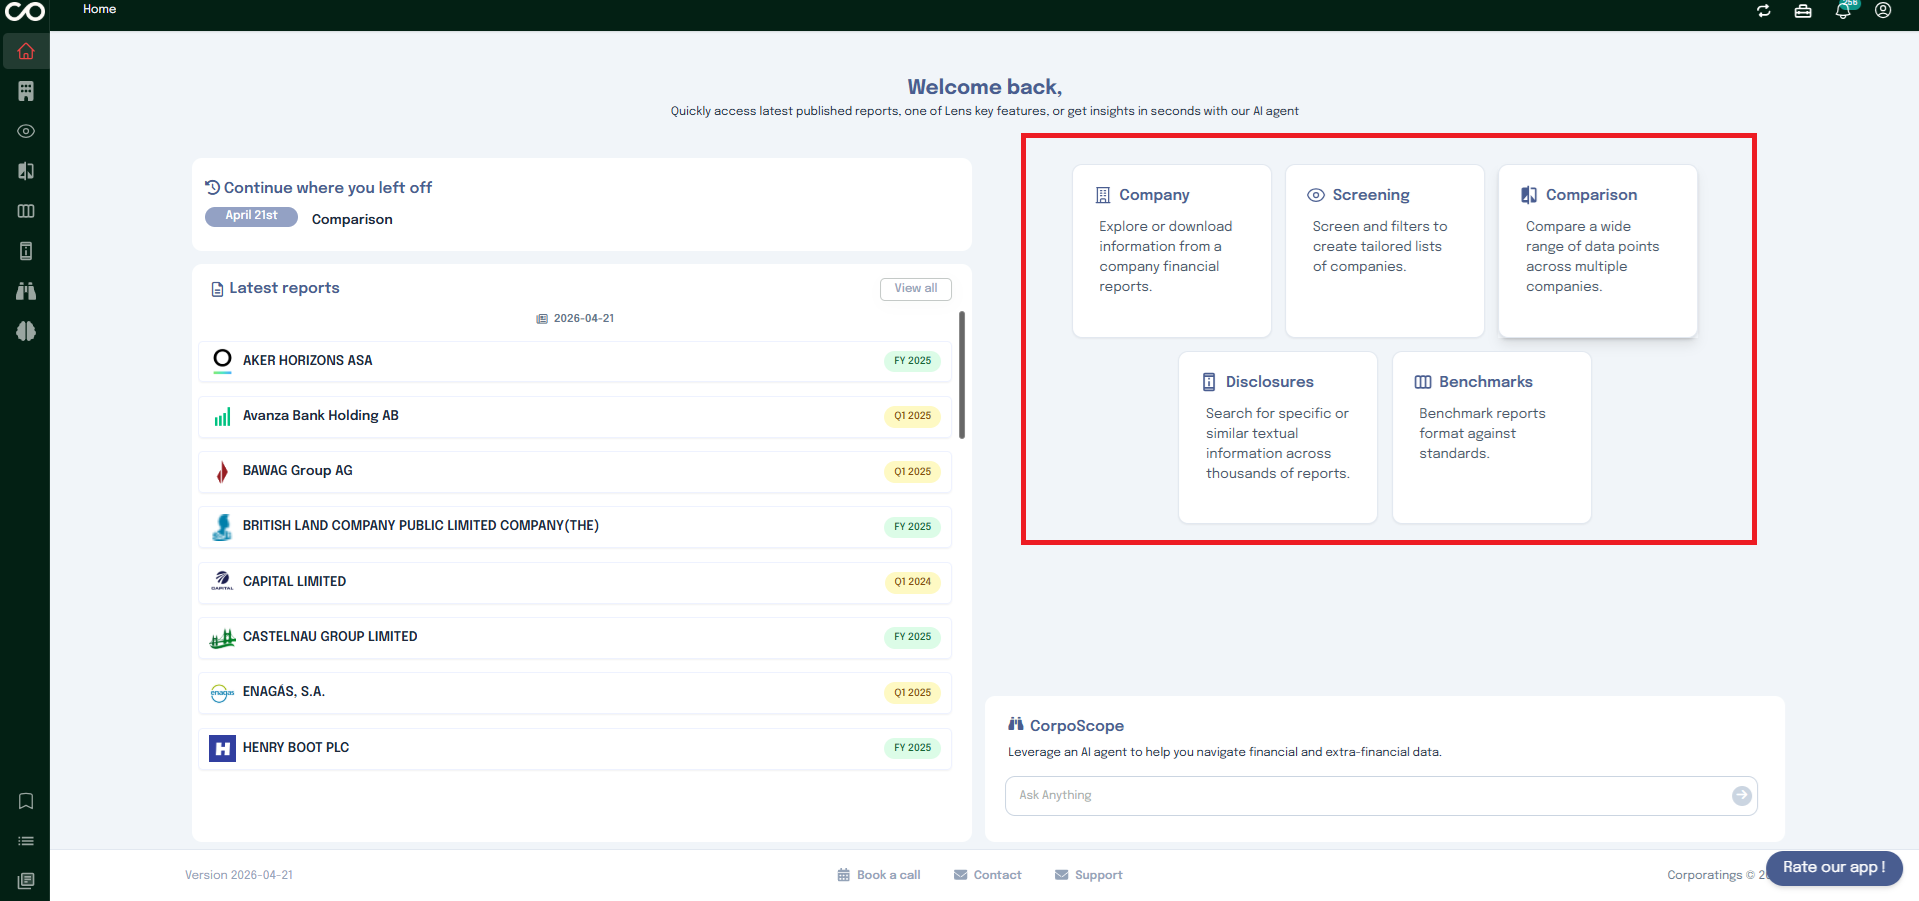
The Home page is your starting point in the application. It gives you a quick overview of your activity and provides direct access to the main sections
of the platform.
From the homepage, you can:
Navigate to any section by clicking on one of the cards displayed on the screen. Each card represents a key area of the application
and takes you directly to it with a single click.
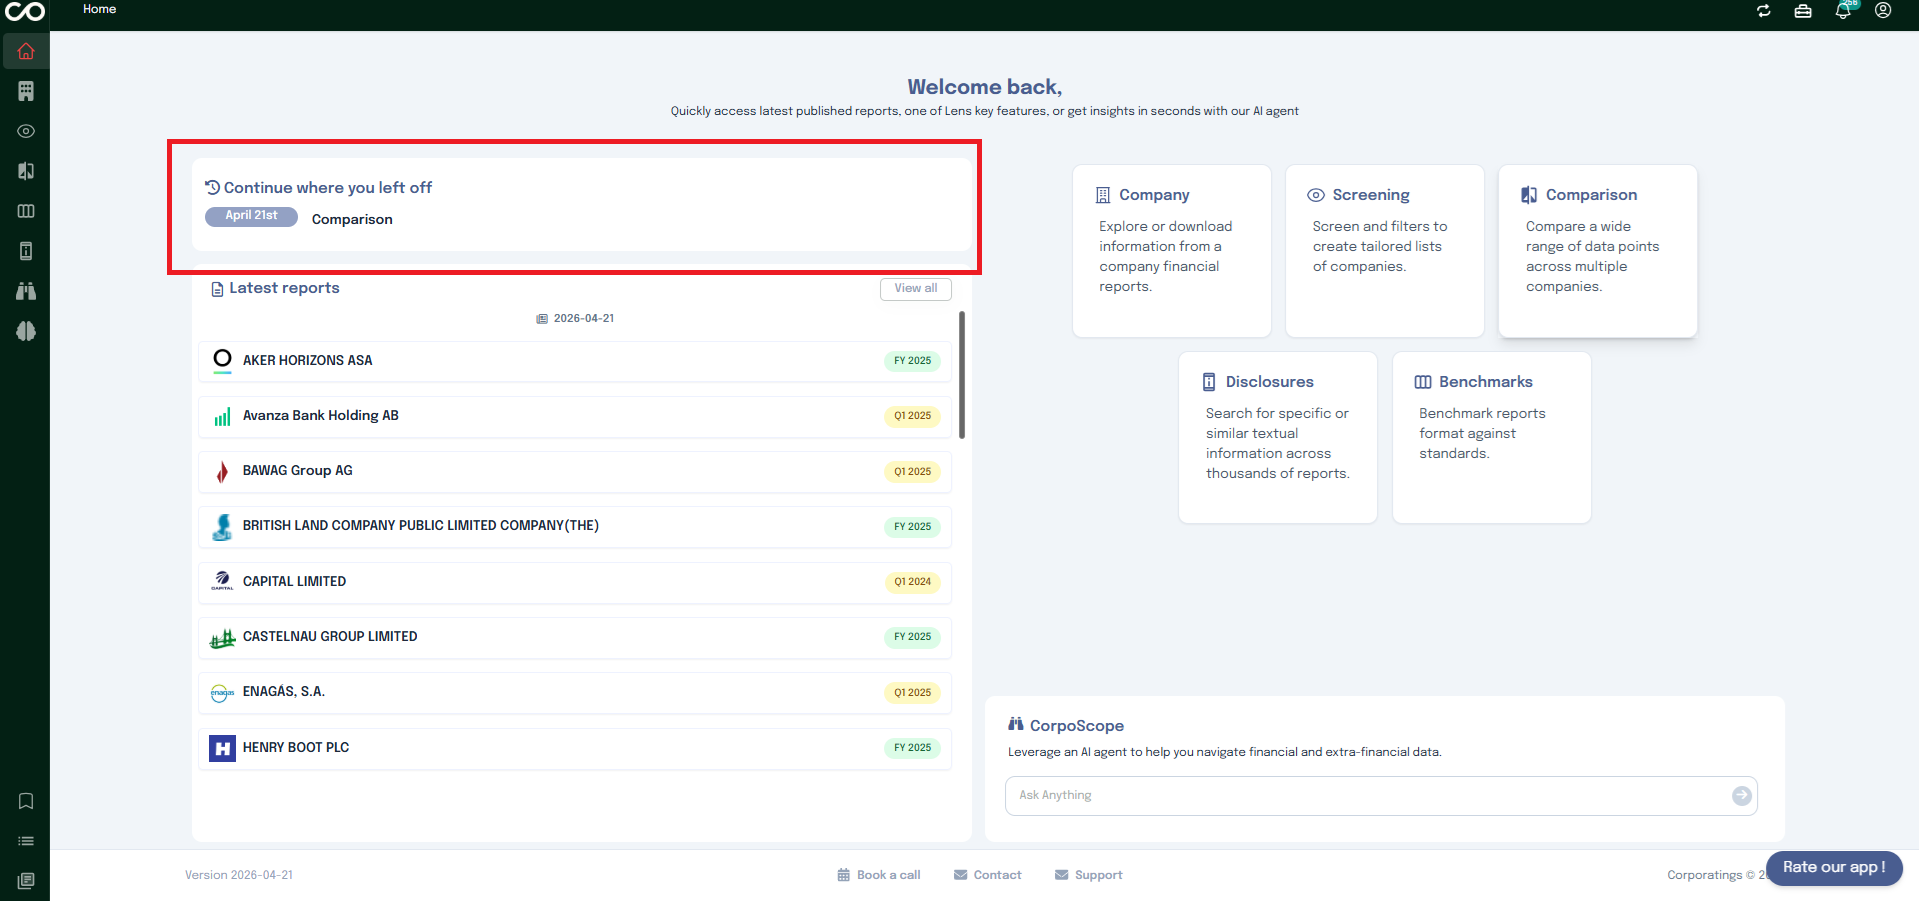
Resume your last activity The homepage remembers your previous session and
lets you pick up right where you stopped, without having to navigate back manually.
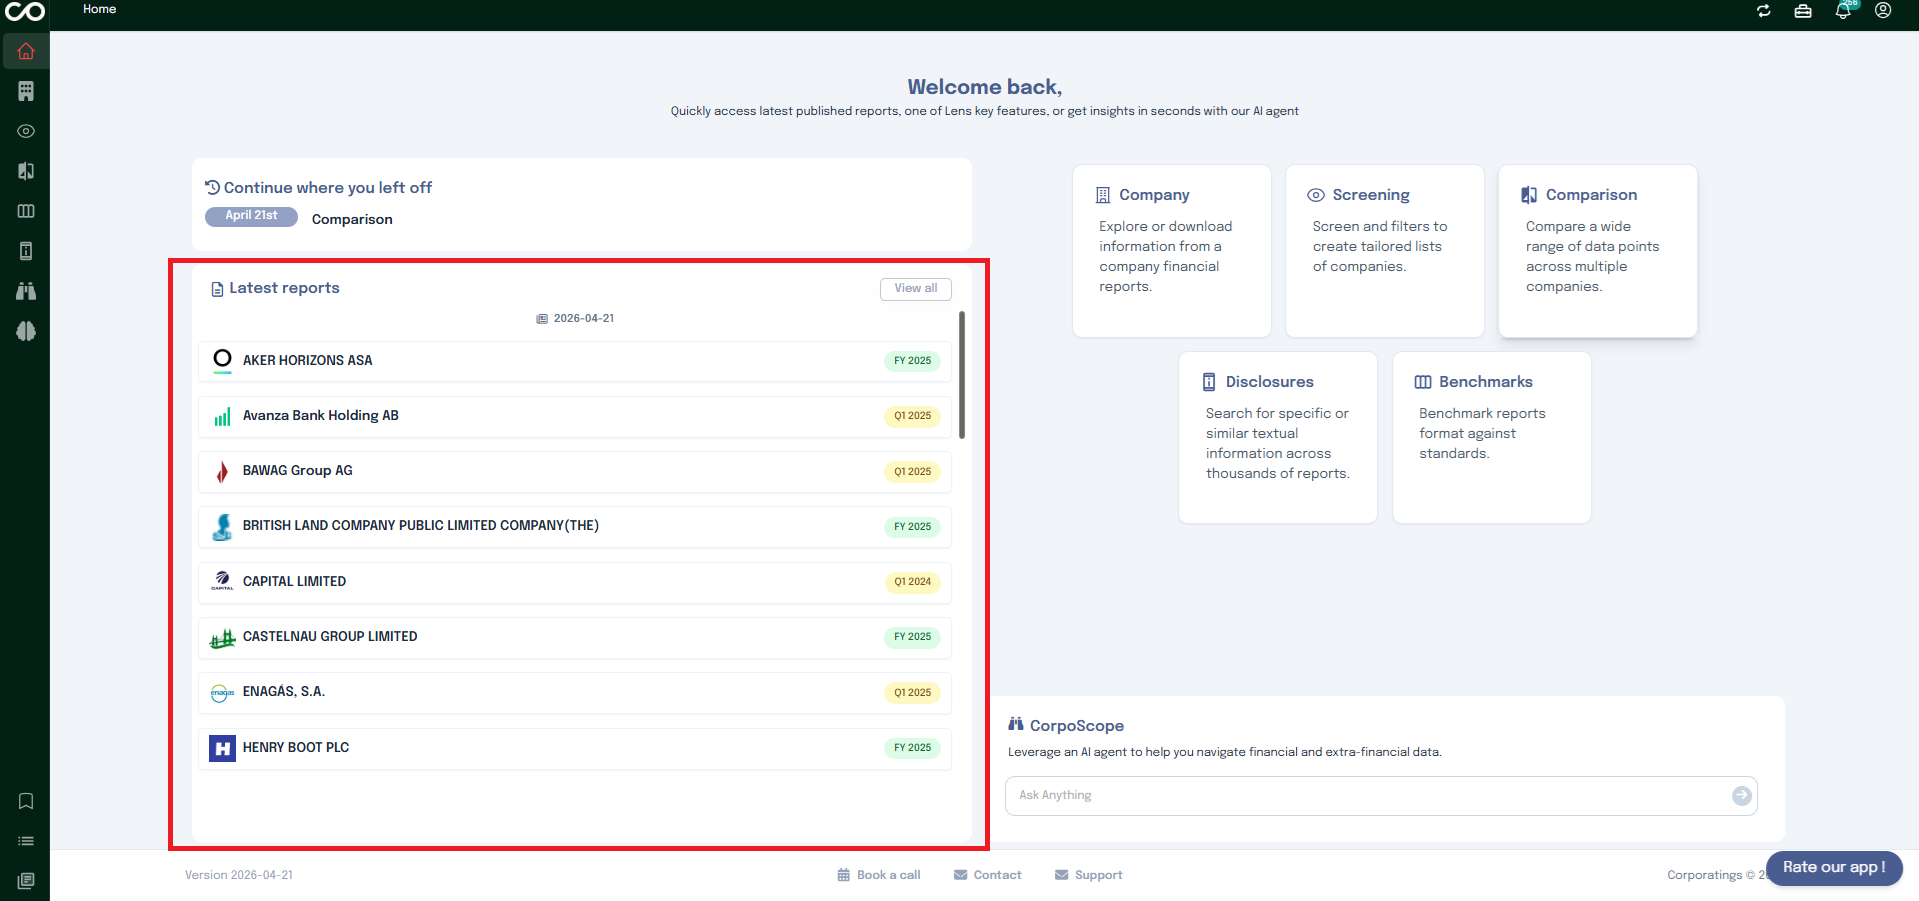
Access the latest reports added to the application. This section surfaces the most recently published reports so you can stay up to
date without having to search for them.
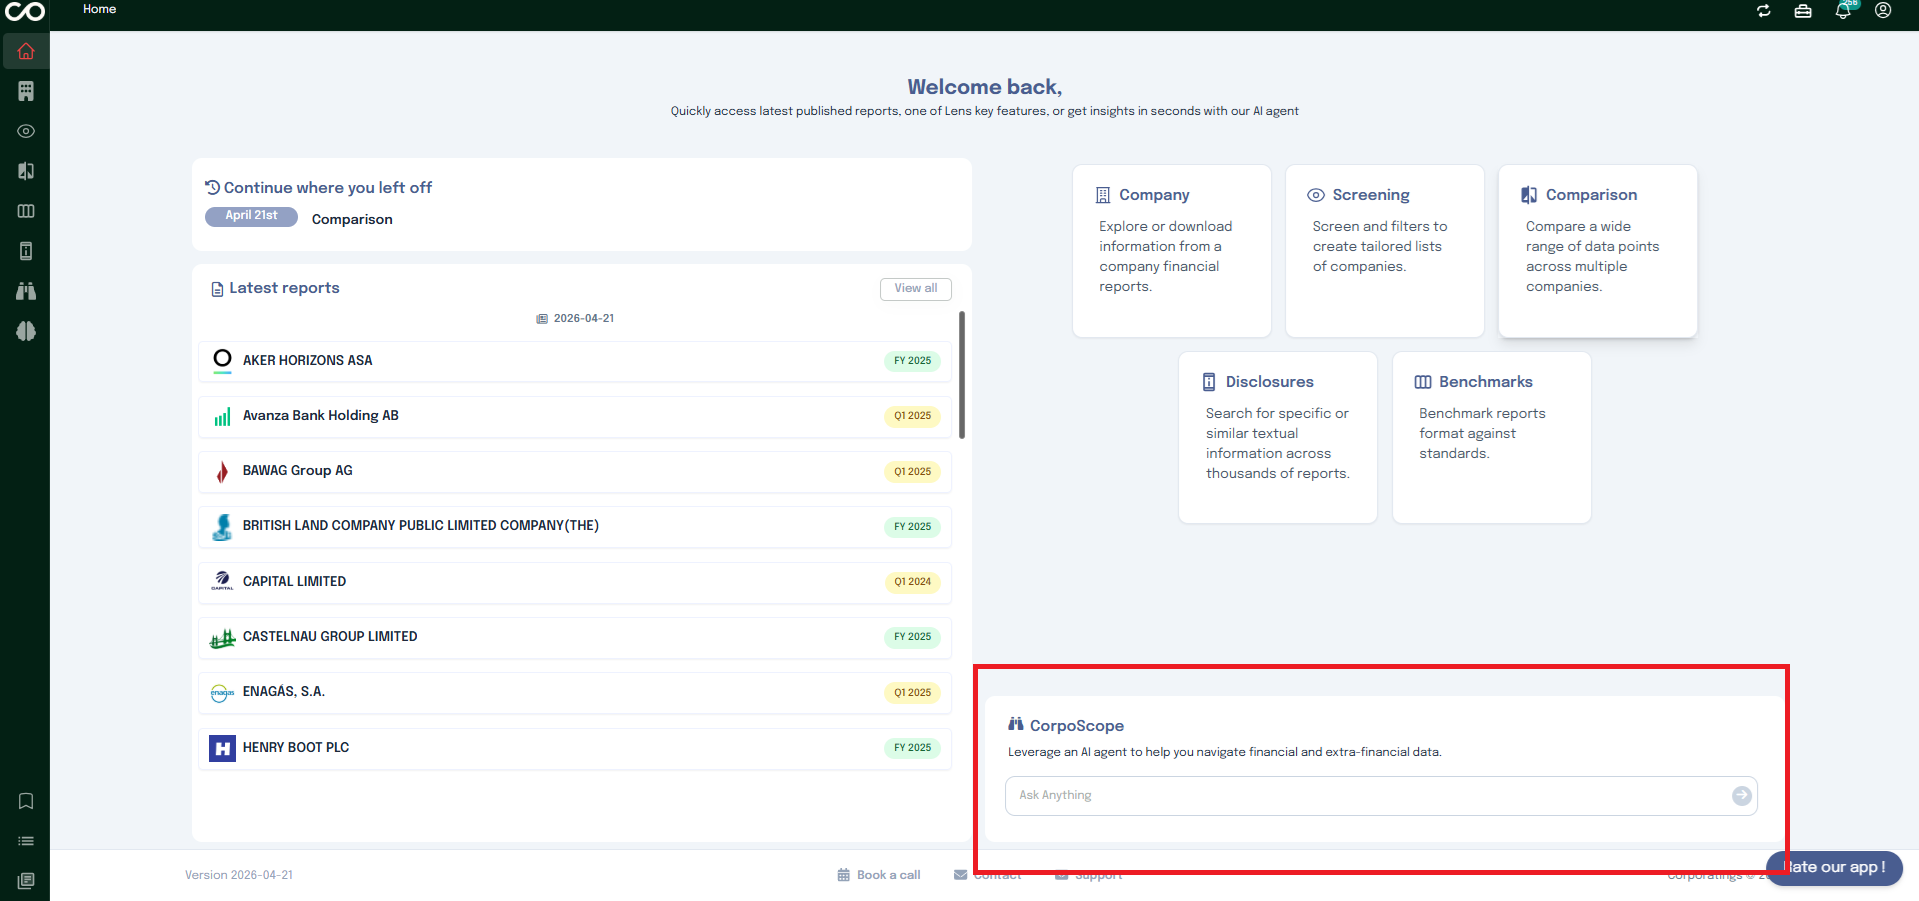
Use the Corposcope, an AI-powered assistant designed to help you navigate financial and extra-financial data. You can ask it
questions in natural language and get relevant insights across the platform's data.
Company
The Company page gives you a complete view of a company, from high-level information to detailed financial data.
You can search for a company, explore its profile, follow its market evolution, review financial statements, and access detailed disclosures, all in one place.
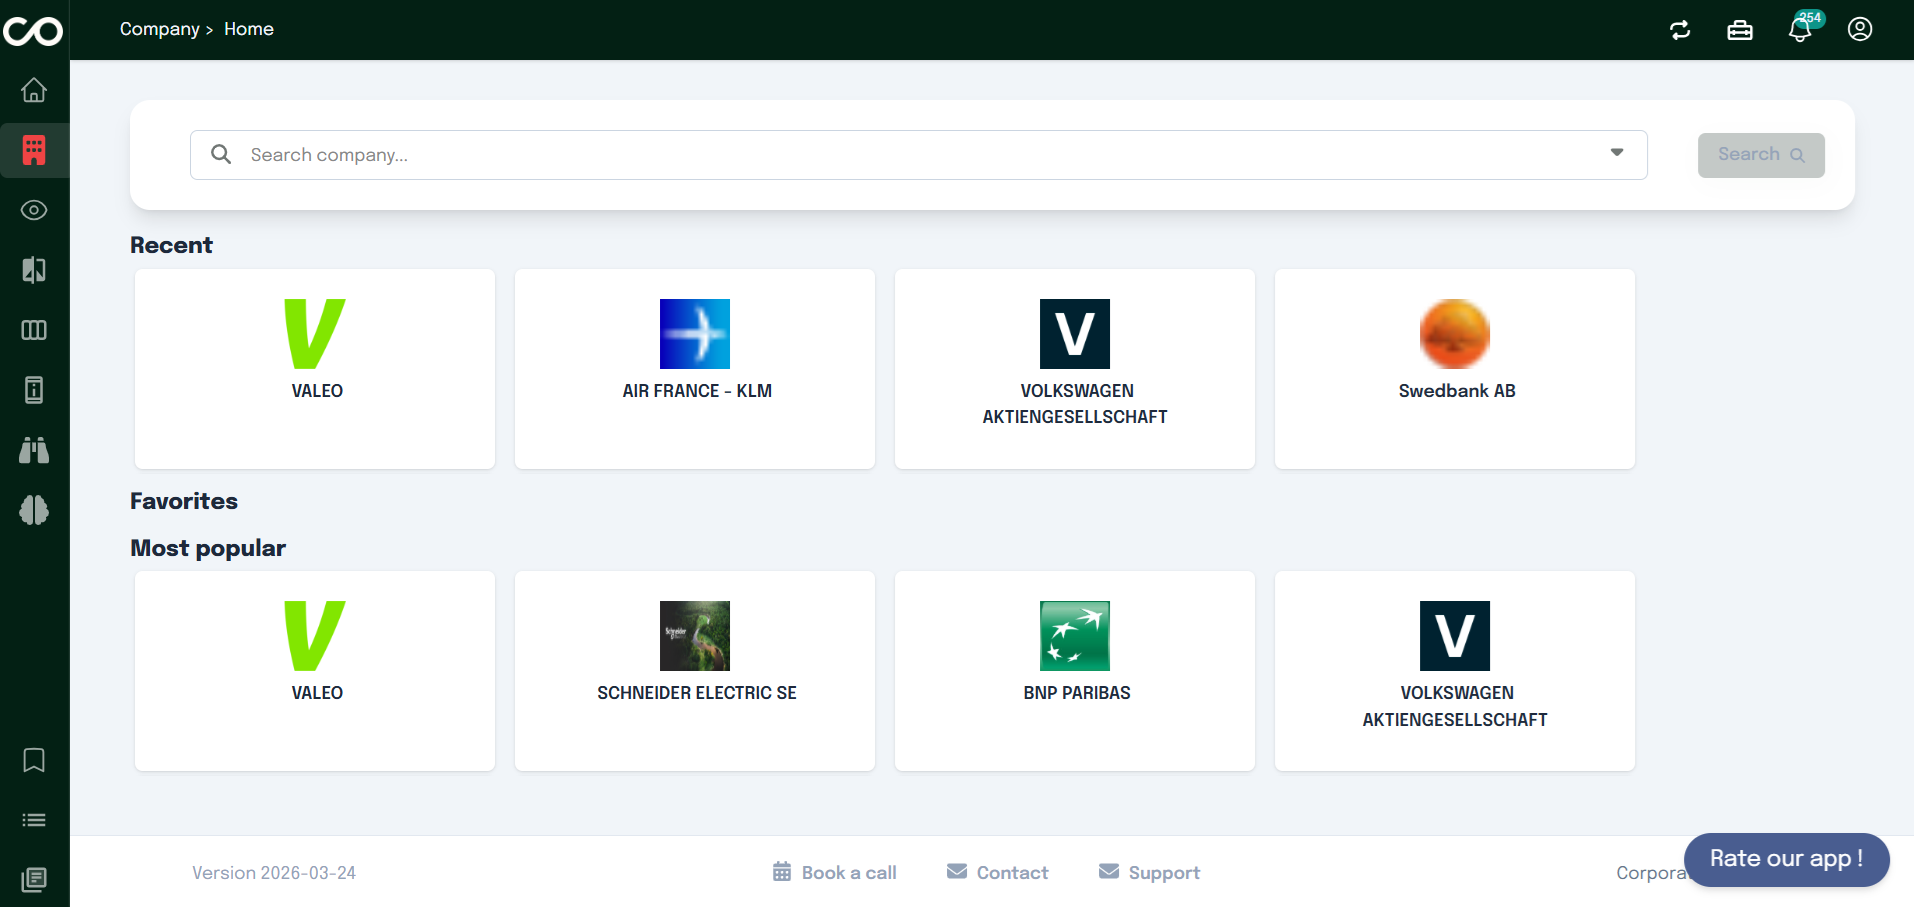
Search for company
When you open the Company page, you first see a search bar at the top of the screen.
This search bar allows you to quickly find a company by typing its name.
As you type, relevant companies appear in the results. Clicking on a company, for example BNP Paribas, takes you directly to its dedicated company page.
Below the search bar, you will also find three sections designed to make navigation easier:
your recent searches
your favorite companies
the most popular companies searched by users
These shortcuts help you quickly access companies you already explored or commonly followed ones.
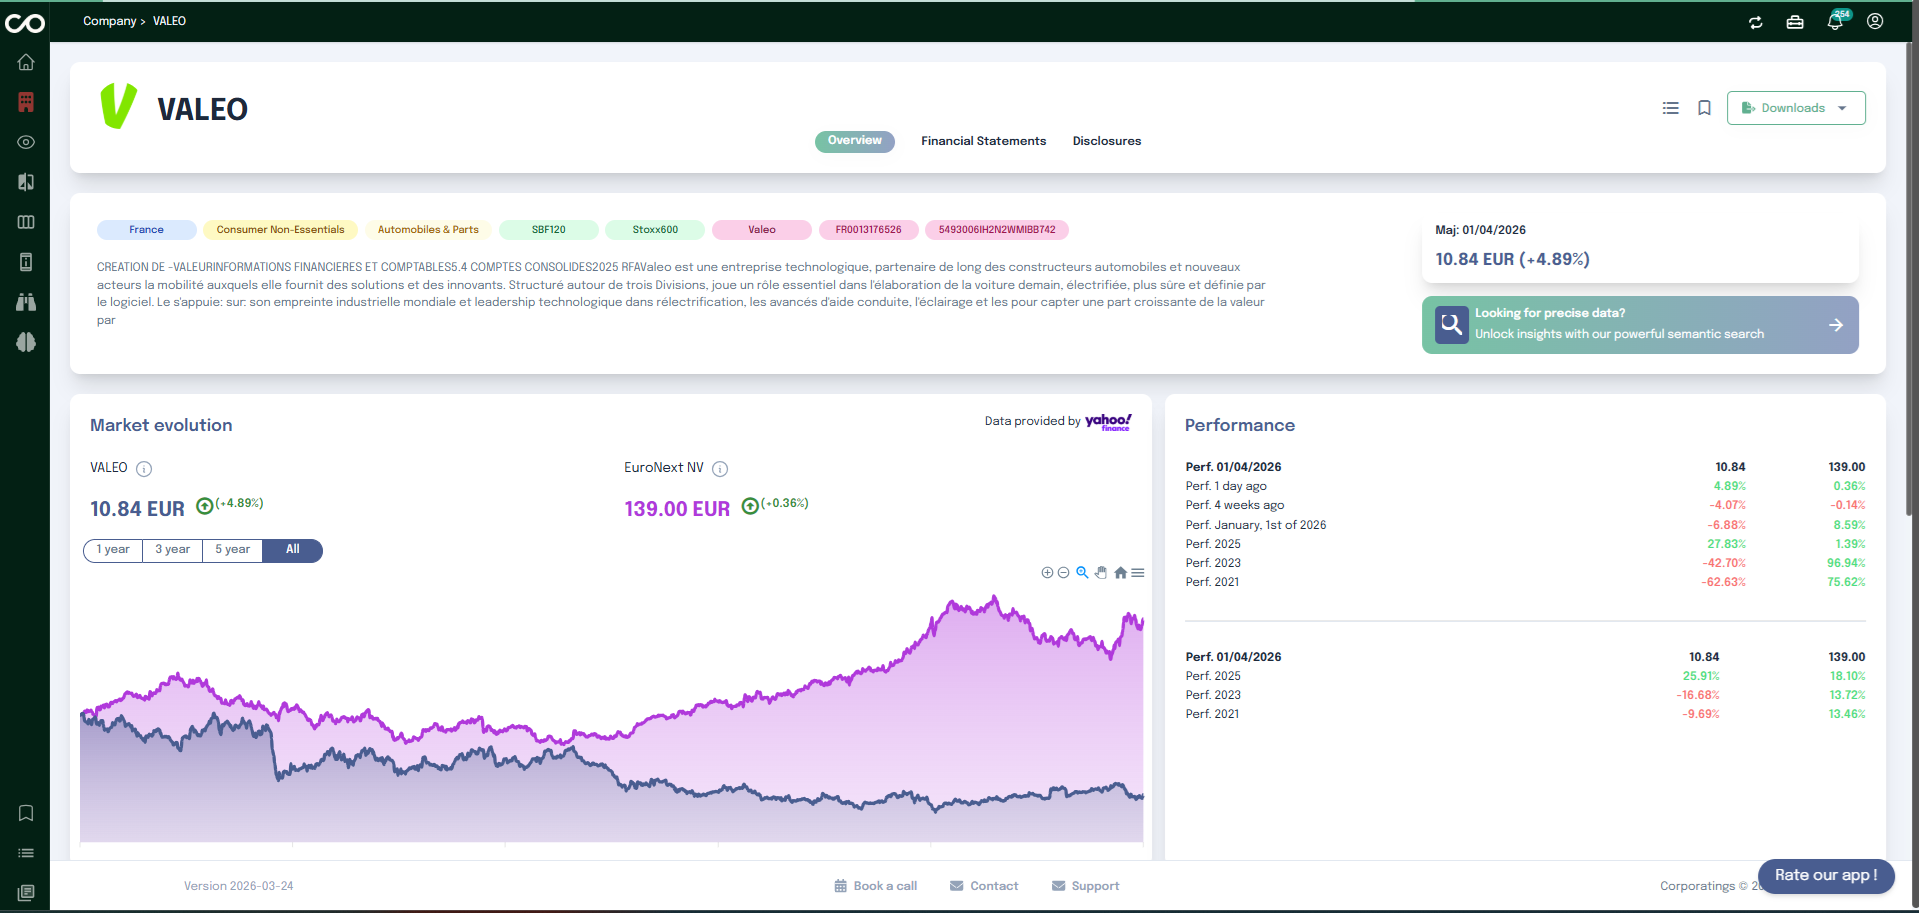
Overview Tab
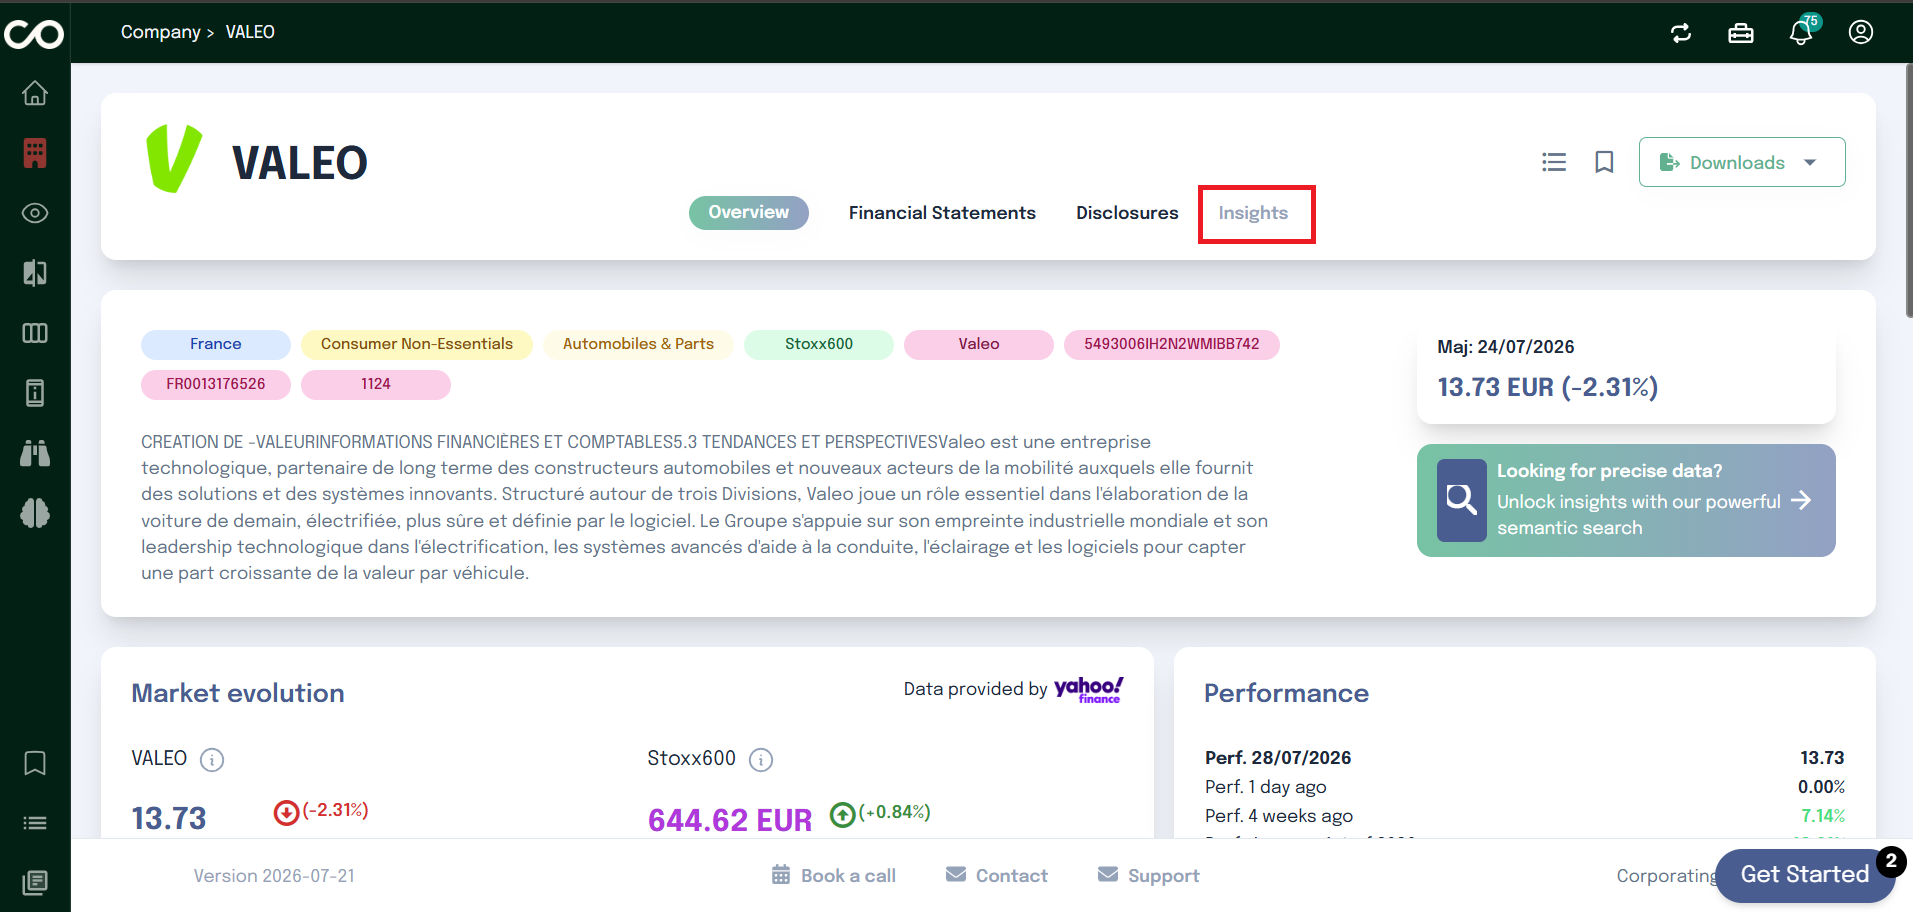
After selecting a company, you land by default on the Overview tab.
This section provides a clear summary of the company. You can see key information such as the company’s country, sector, and type of activity. A short description explains what the company does and its position within its group.
Below this summary, you will find the Market Evolution chart. This graph shows how the company has evolved over time on the market, helping you quickly understand its performance trend.
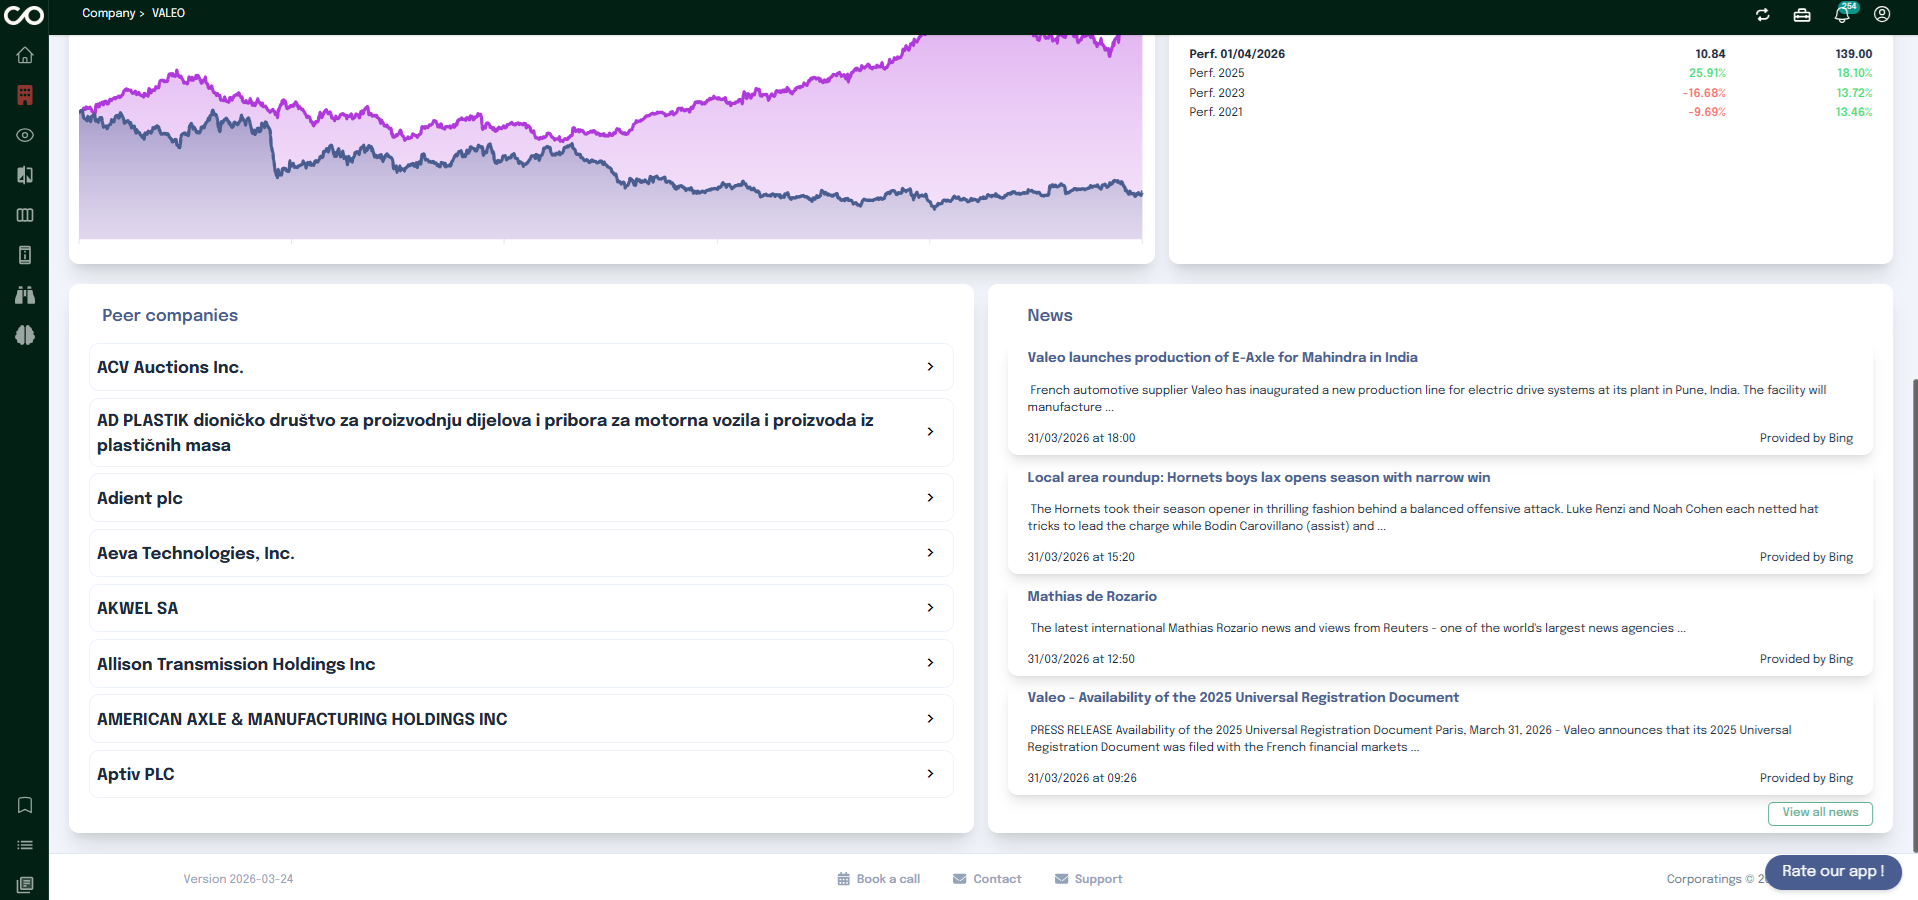
Further down the page, you can explore the company’s peer companies, which helps you identify comparable organizations in the same sector.
On the right side of the overview, a News section displays the latest articles and updates related to the company, allowing you to stay informed about recent developments.
Downloading Company Documents
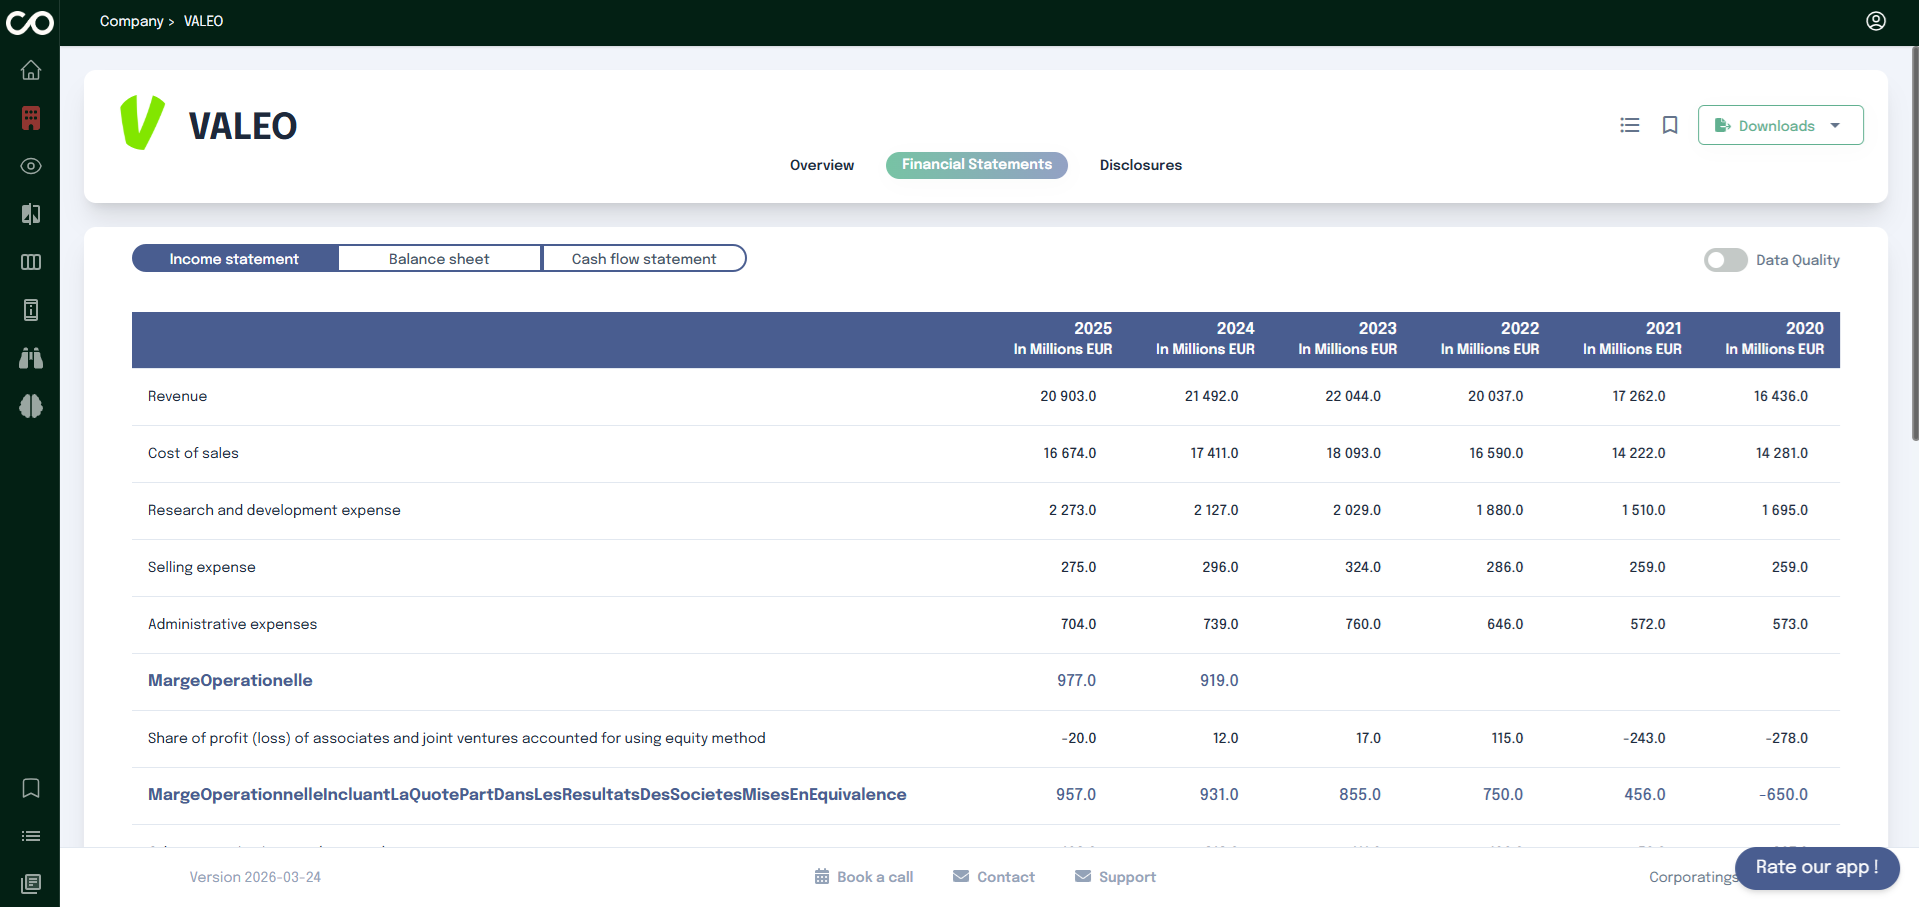
Financial Statements Tab
The Financial Statements tab allows you to explore the company's financial data in a structured and comparable way.
It is organized into three sub-tabs, each covering a distinct area of the company's finances:
Income Statement Presents the income statement in the same structure as in official filings (e.g. universal registration document, half-year reports, annual reports). A multi-period historical view is available, and each value is clickable so you can trace it back to the exact location in the source document.
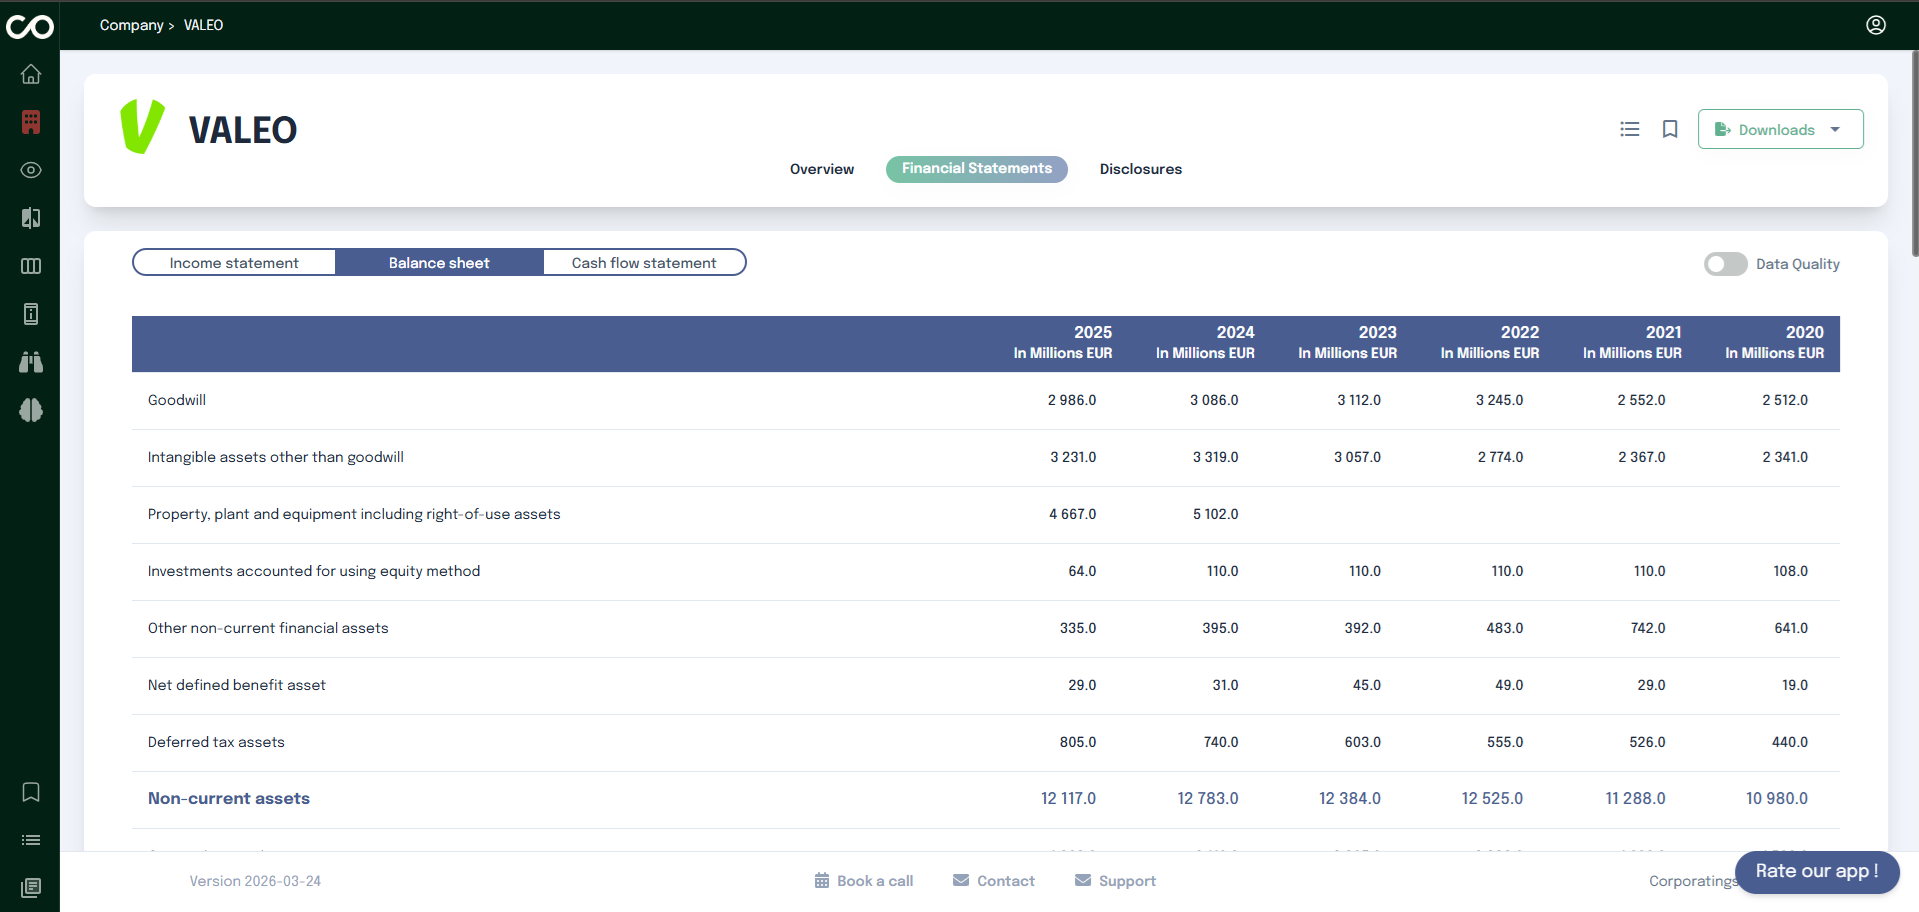
Balance Sheet Provides a snapshot of the company's assets and liabilities at a given reporting date. It includes non-current and current assets.
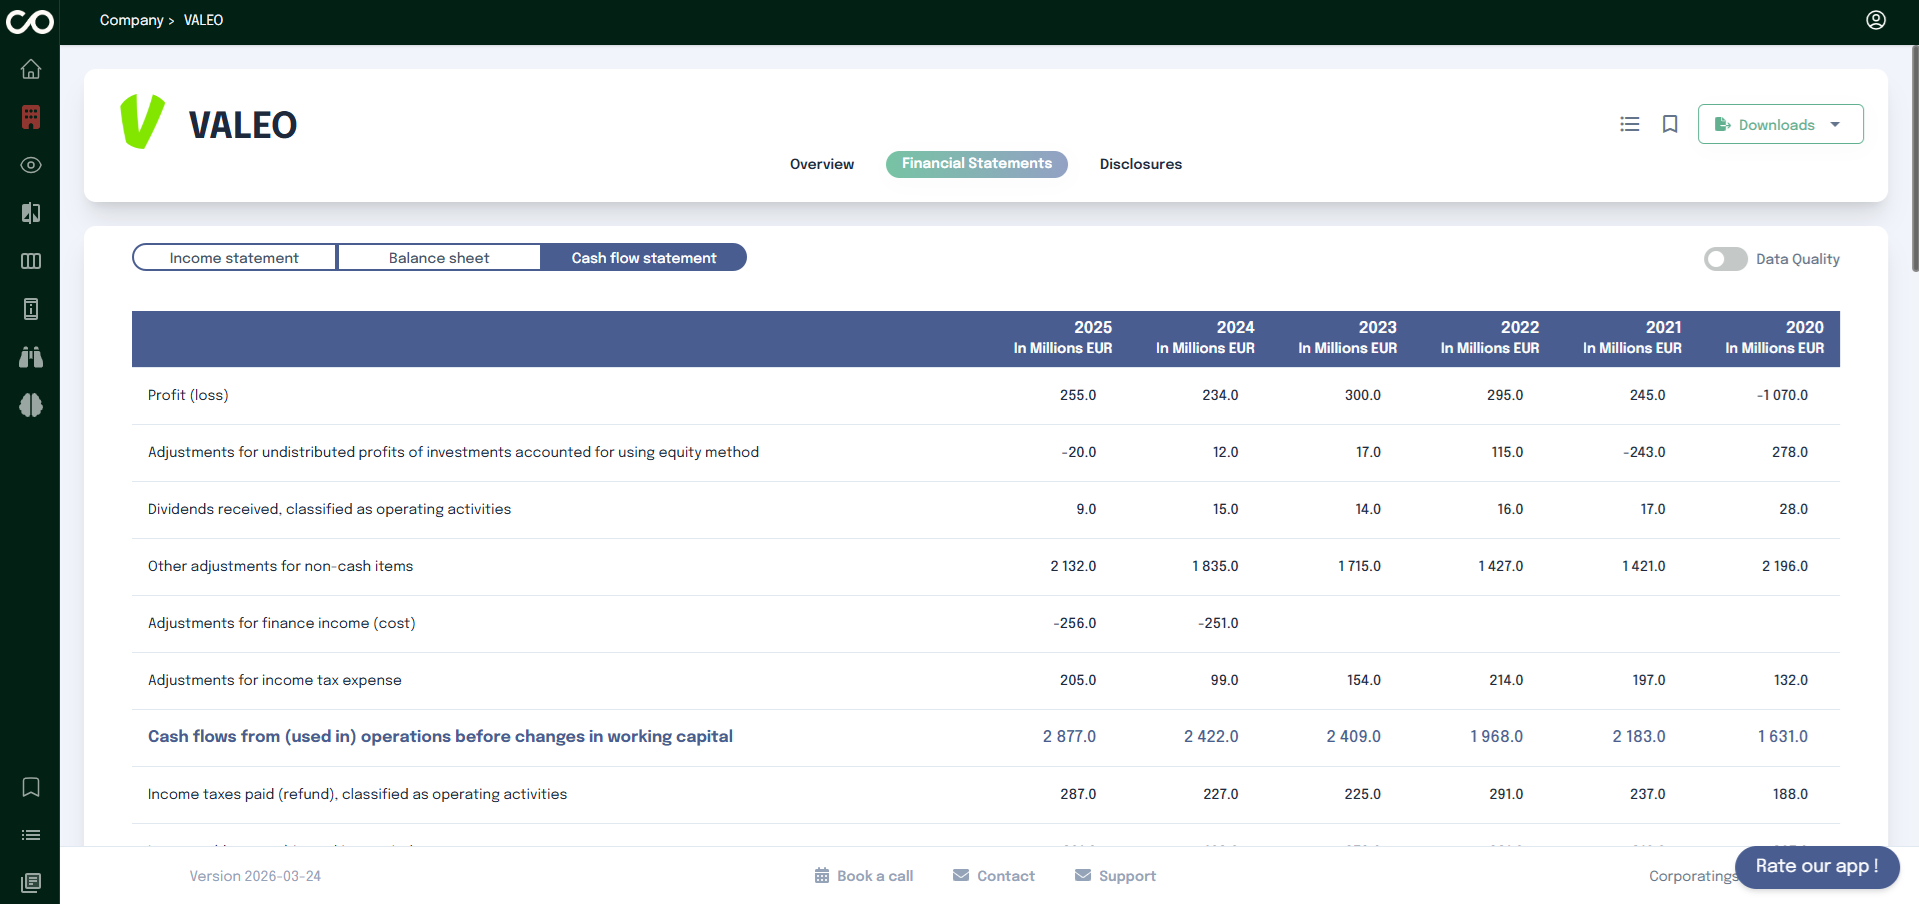
Cash Flow Statement Details how cash was generated and used during the reporting period. It covers operating activities, investing activities, and financing activities, including items such as profit loss, Adjustments for income tax expense...
The main element of each sub-tab is a large financial table. On the left side, you will find the list of financial items each row represents a specific metric reported by the company. Across the top, each column corresponds to a reporting year, with the most recent year appearing first. This layout lets you compare the same metric across multiple years at a glance and quickly identify trends, increases, or decreases over time. All values are expressed in a consistent unit indicated in the table header (e.g. In Millions EUR).
Every value in the table is clickable. Clicking on a figure opens the company's source report in a new tab and automatically navigates to the exact location in the document where that figure appears. This allows you to verify the data directly in its original context without having to search manually through the report.
Disclosures Tab
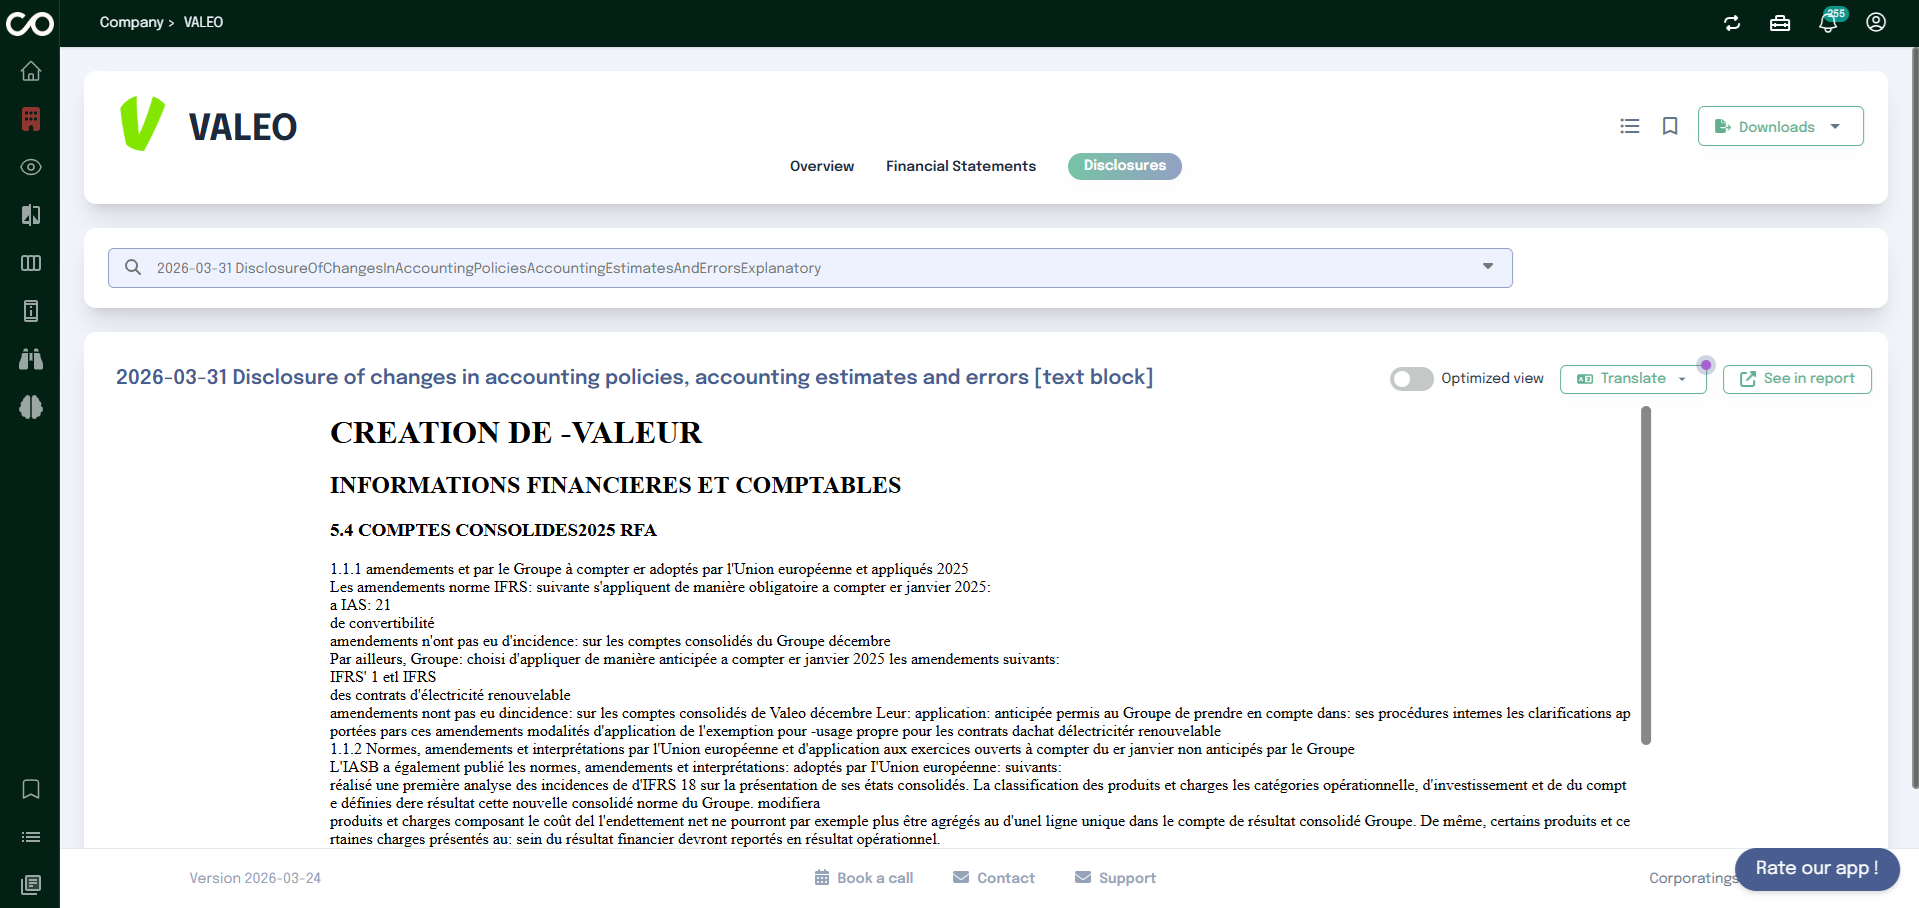
The Disclosures tab gives access to the narrative and explanatory items that companies publish alongside their figures in regulatory filings. A disclosure is a labeled block of text or information (for example on accounting policies, estimates, segment reporting, or risk) that is tied to a standard taxonomy so each item can be identified consistently and linked back to where it appears in the official report.
At the top, use the search field or dropdown to find and select a disclosure. When you choose one, the main panel shows the excerpt from the filing that corresponds to that disclosure the same passage as in the source document, not a generic summary.
Above the content you can:
Translate : Open the language menu to display the disclosure in the language you prefer.
See in report : Open the original report and jump straight to the location where this disclosure appears, so you can read it in full context.
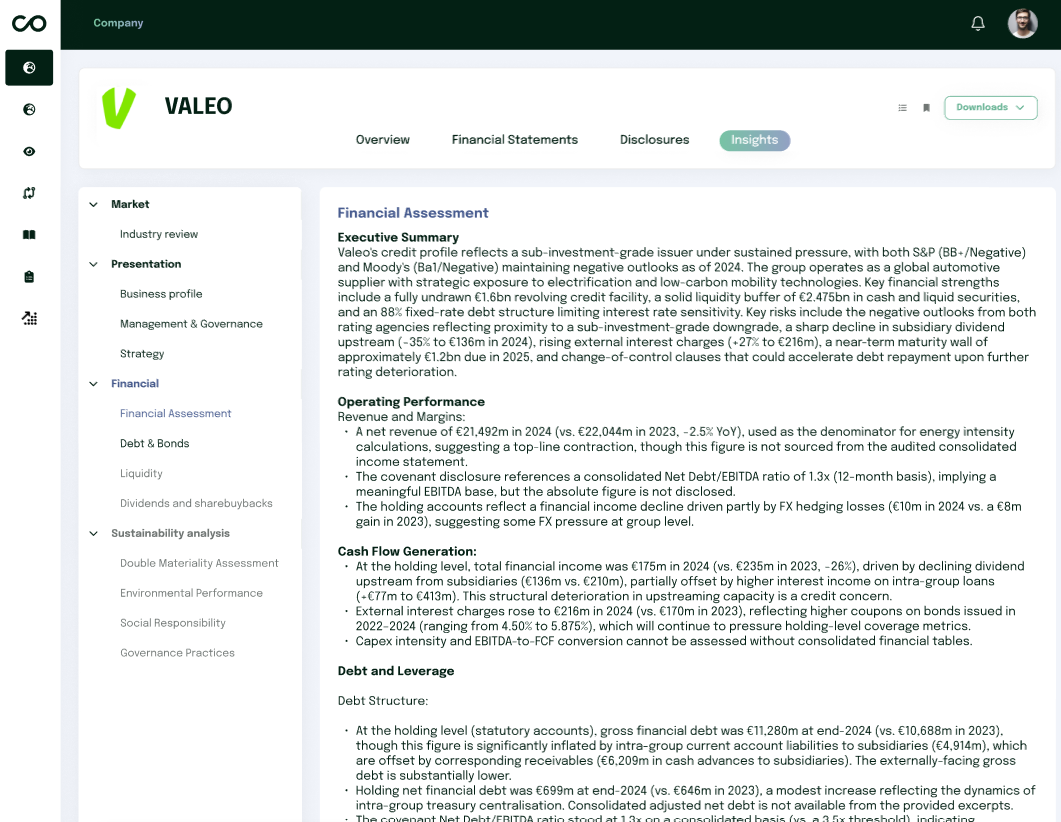
Insights Tab
The Insights tab gives you access to AI-generated analysis of the selected company, organized by topic so you can quickly find the assessment you need without reading the full report.
On the left, a navigation tree groups the available insights into four categories:
Market : Industry review
Presentation : Business profile, Management & Governance, Strategy
Clicking an item in the tree displays the corresponding insight in the main panel, as a structured write-up rather than raw figures. Each insight opens with an executive summary and is then broken down into several subsections covering the aspects most relevant to that topic these subsections are generated dynamically and can vary from one company to another. A Financial Assessment, for instance, may cover operating performance, debt structure and maturity, liquidity, financial policy, and a concluding assessment, depending on what is actually disclosed by the company.
Every claim is grounded in figures and disclosures pulled directly from the company's reports, so the text reads as an analyst-style commentary rather than a generic summary.
Insights are also included in the Downloads menu at the top-right of the company page: you can export them together with the other available documents instead of copying the text manually.
Screening
The Screening page allows you to build a selection of companies based on specific criteria, and use that selection across other sections of the
application.
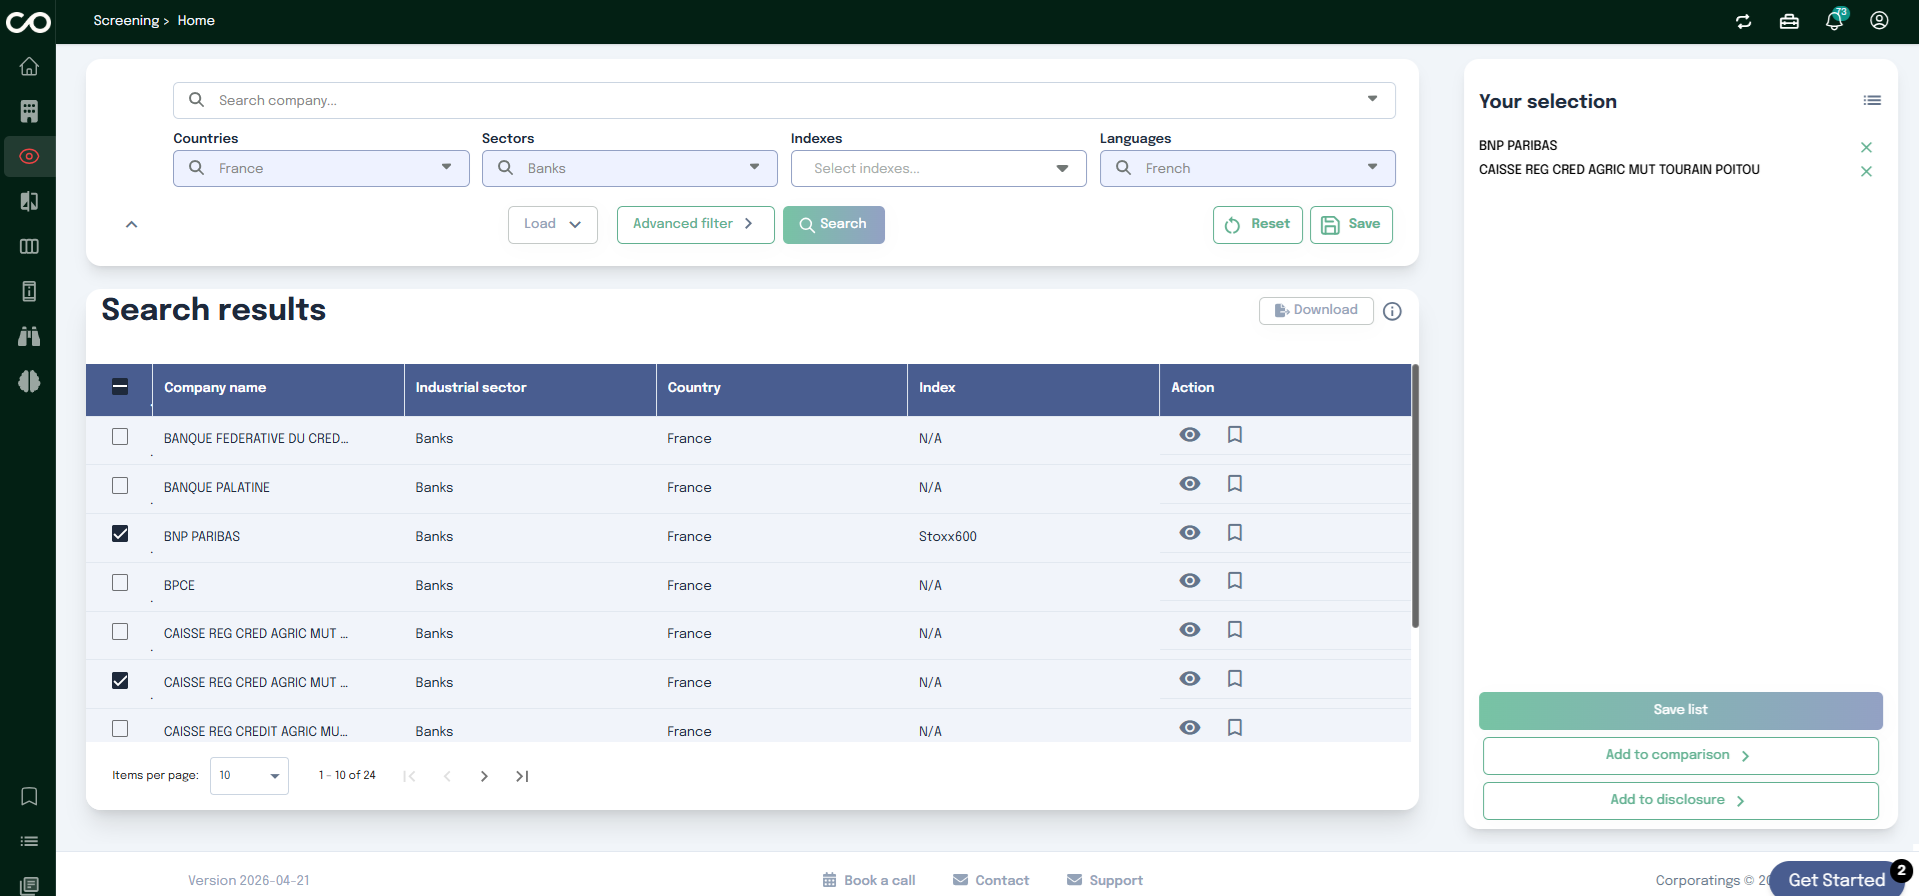
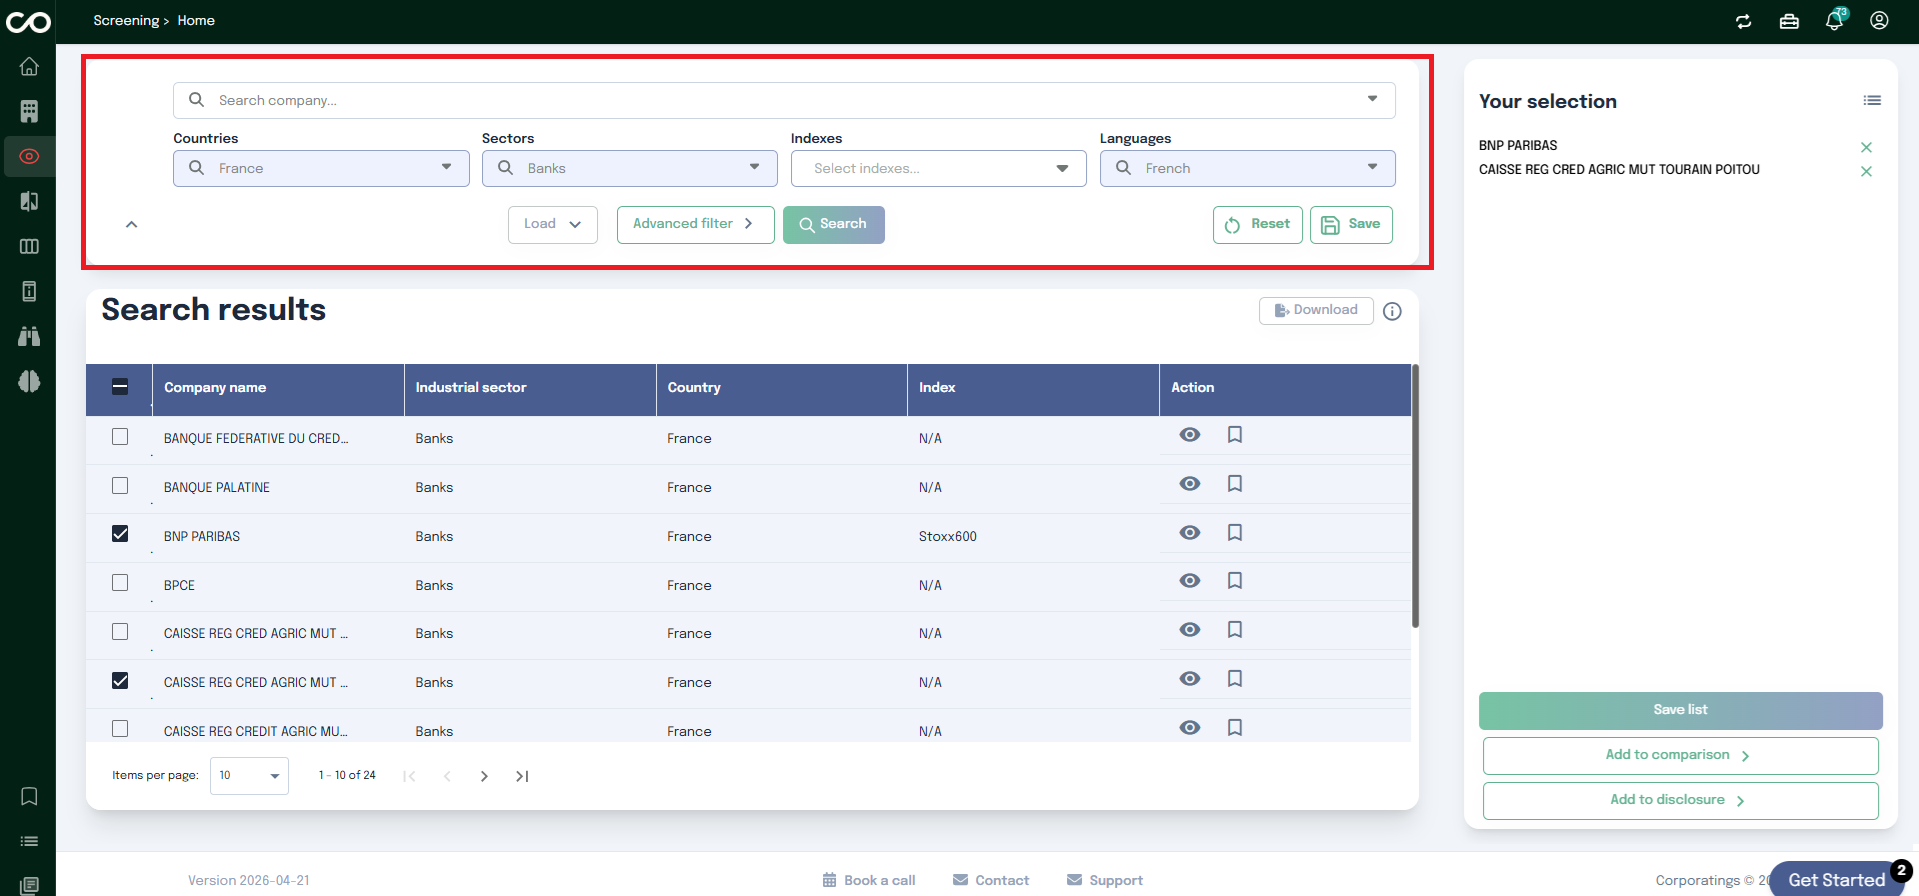
Search and Filter
At the top of the page, you can define your search criteria using a set of filters:
Countries : filter companies by geographic location
Sectors : narrow down by industry or activity sector
Indexes : target companies belonging to specific market indexes
Languages : filter based on the language of available data
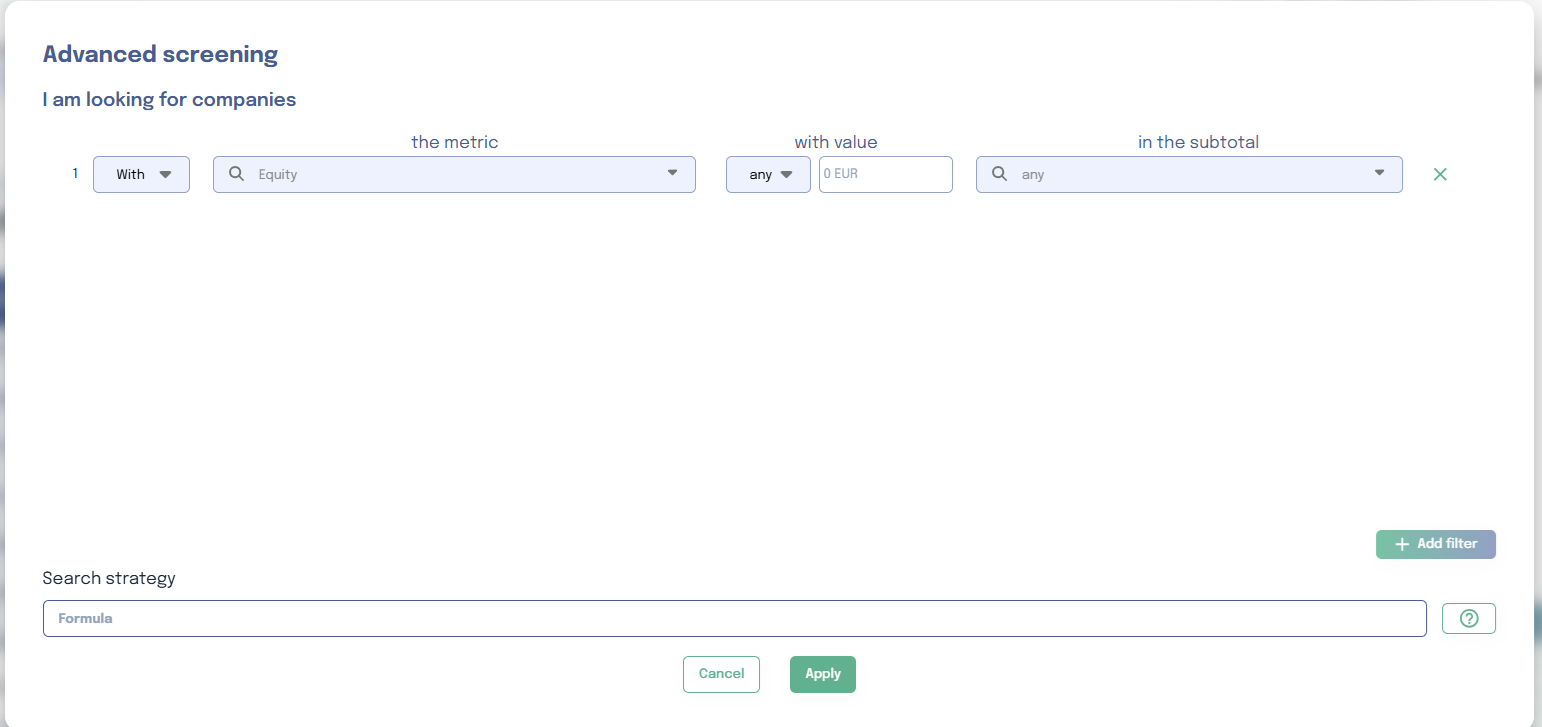
If you need more precision, you can expand the Advanced Filters panel to filter companies by a specific financial or extra-financial
metric.
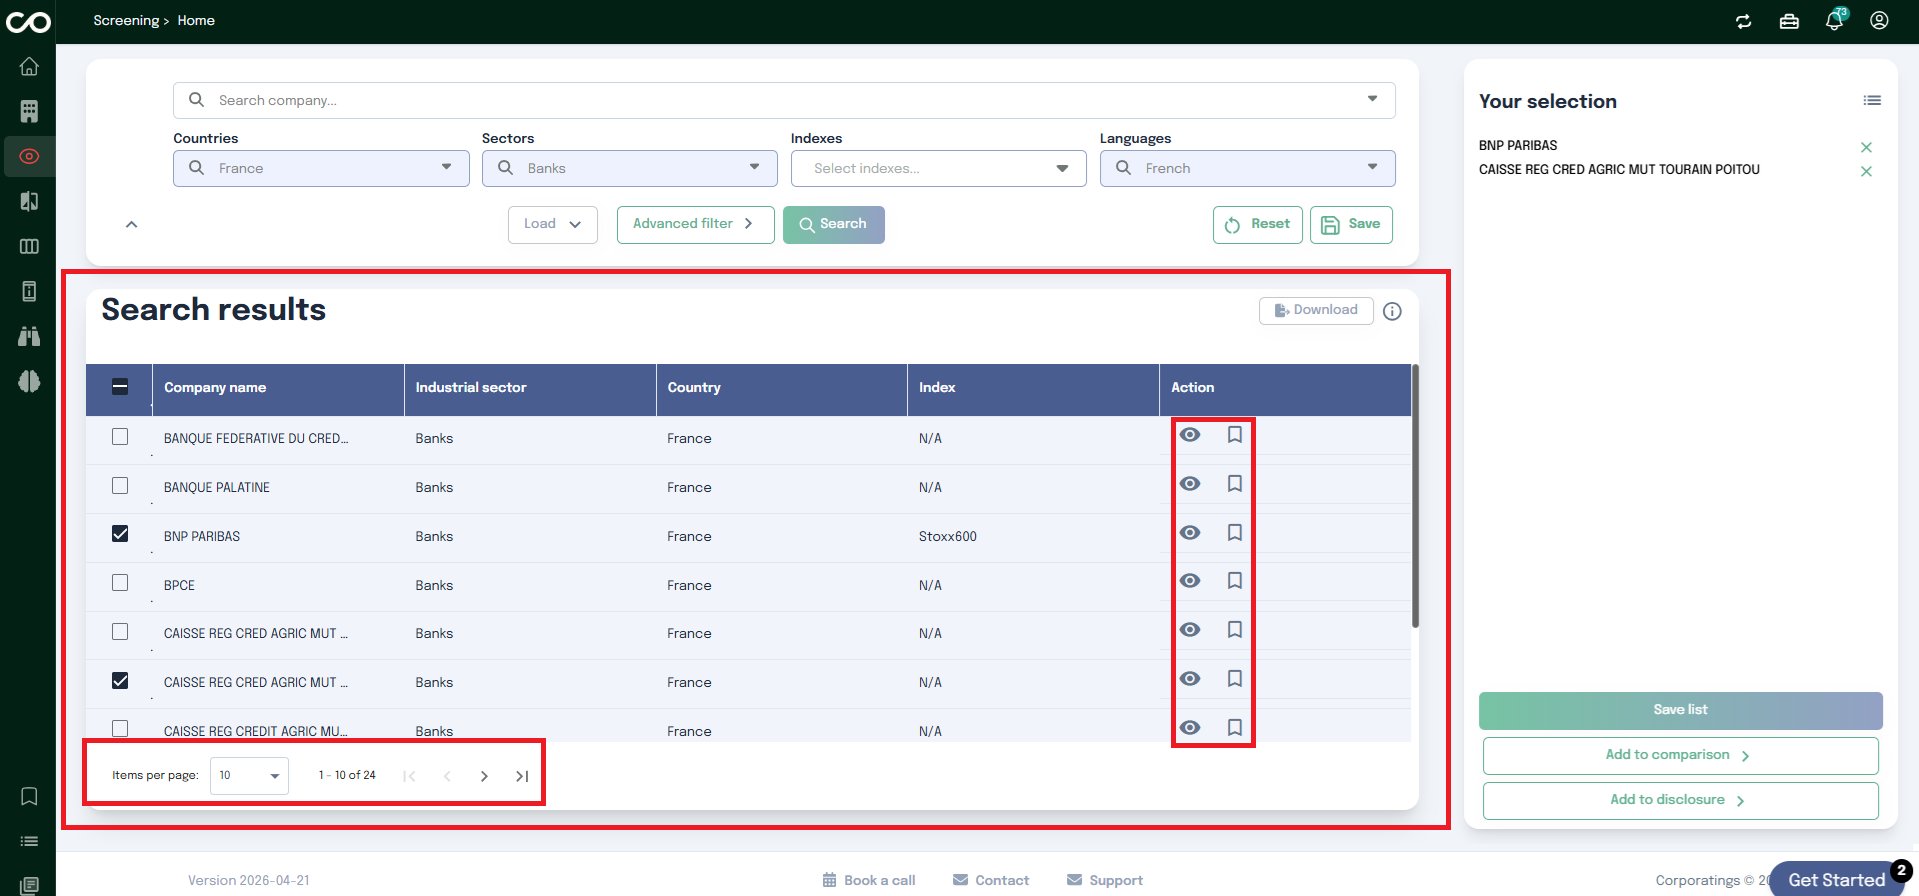
Once your criteria are set, launch the search. All companies matching your filters will be displayed in the results table below.
Results Table
The results are presented in a table with the following columns: Company name, Industrial sector,
Country, Index, and Actions.
The Actions column provides two quick-access buttons for each company:
Navigate directly to the company's dedicated page
Add the company to your favorites
At the bottom of the table, you can control the number of results displayed per page using the Items per page setting.
Building a Selection
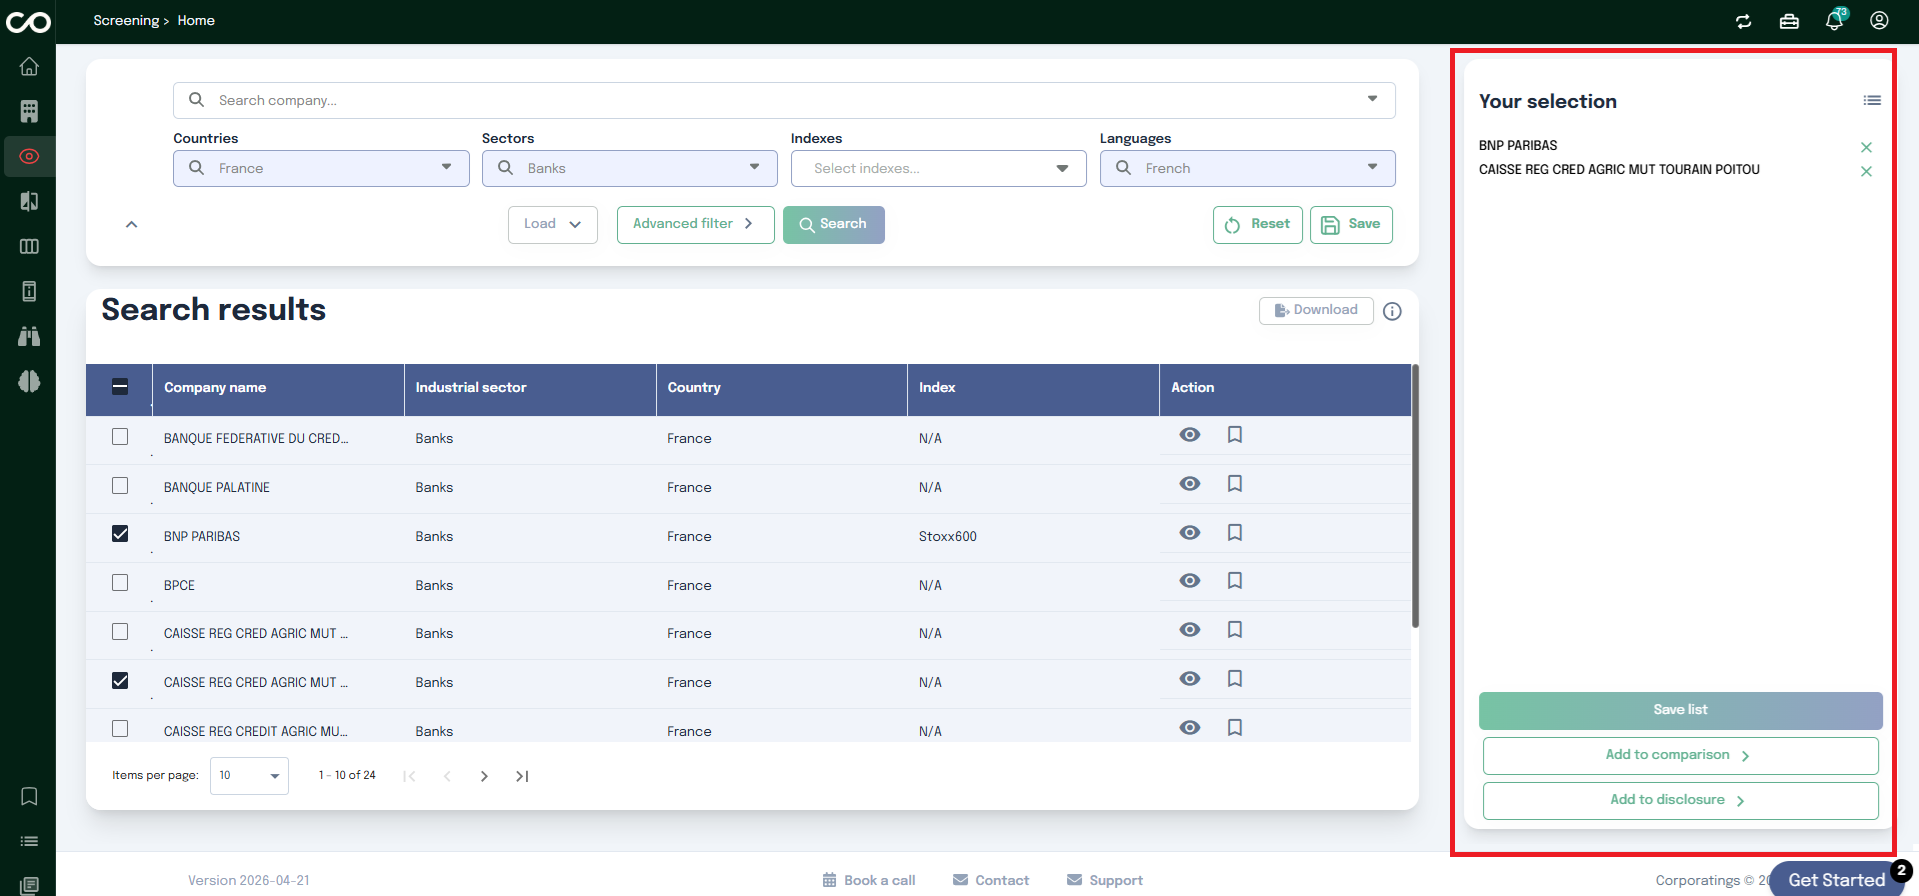
You can select one or multiple companies by checking the checkbox next to each row. Selected companies are added to your current selection.
Once your selection is ready, three options are available:
Save the list : store your selection for future use
Add to Comparison : navigate directly to the Comparison page with your selected companies preloaded
Add to Disclosure : navigate directly to the Disclosure page with your selection
Comparison
The Comparison page allows users to analyze multiple companies simultaneously, providing a clear and actionable overview without the need to review multiple reports individually.
Step 1: Build the Comparison Scope
At the top of the page, three groups of controls let you define exactly what you want to compare:
Companies : search and select two or more companies to compare. Use the Advanced filter link next to the search field to refine the company selection, and the ⋮ menu for additional company-level options.
Metrics : add what you want to compare for each company using Add Metric (quantitative indicators, e.g. Profit (loss)), Add Disclosure (reported qualitative information, e.g. Disclosure of income tax), or Add Table (a predefined set of metrics and/or disclosures grouped as a template).
Years : use Add years to add one or more reporting years to the comparison, and the Original toggle to switch between restated and originally reported periods.
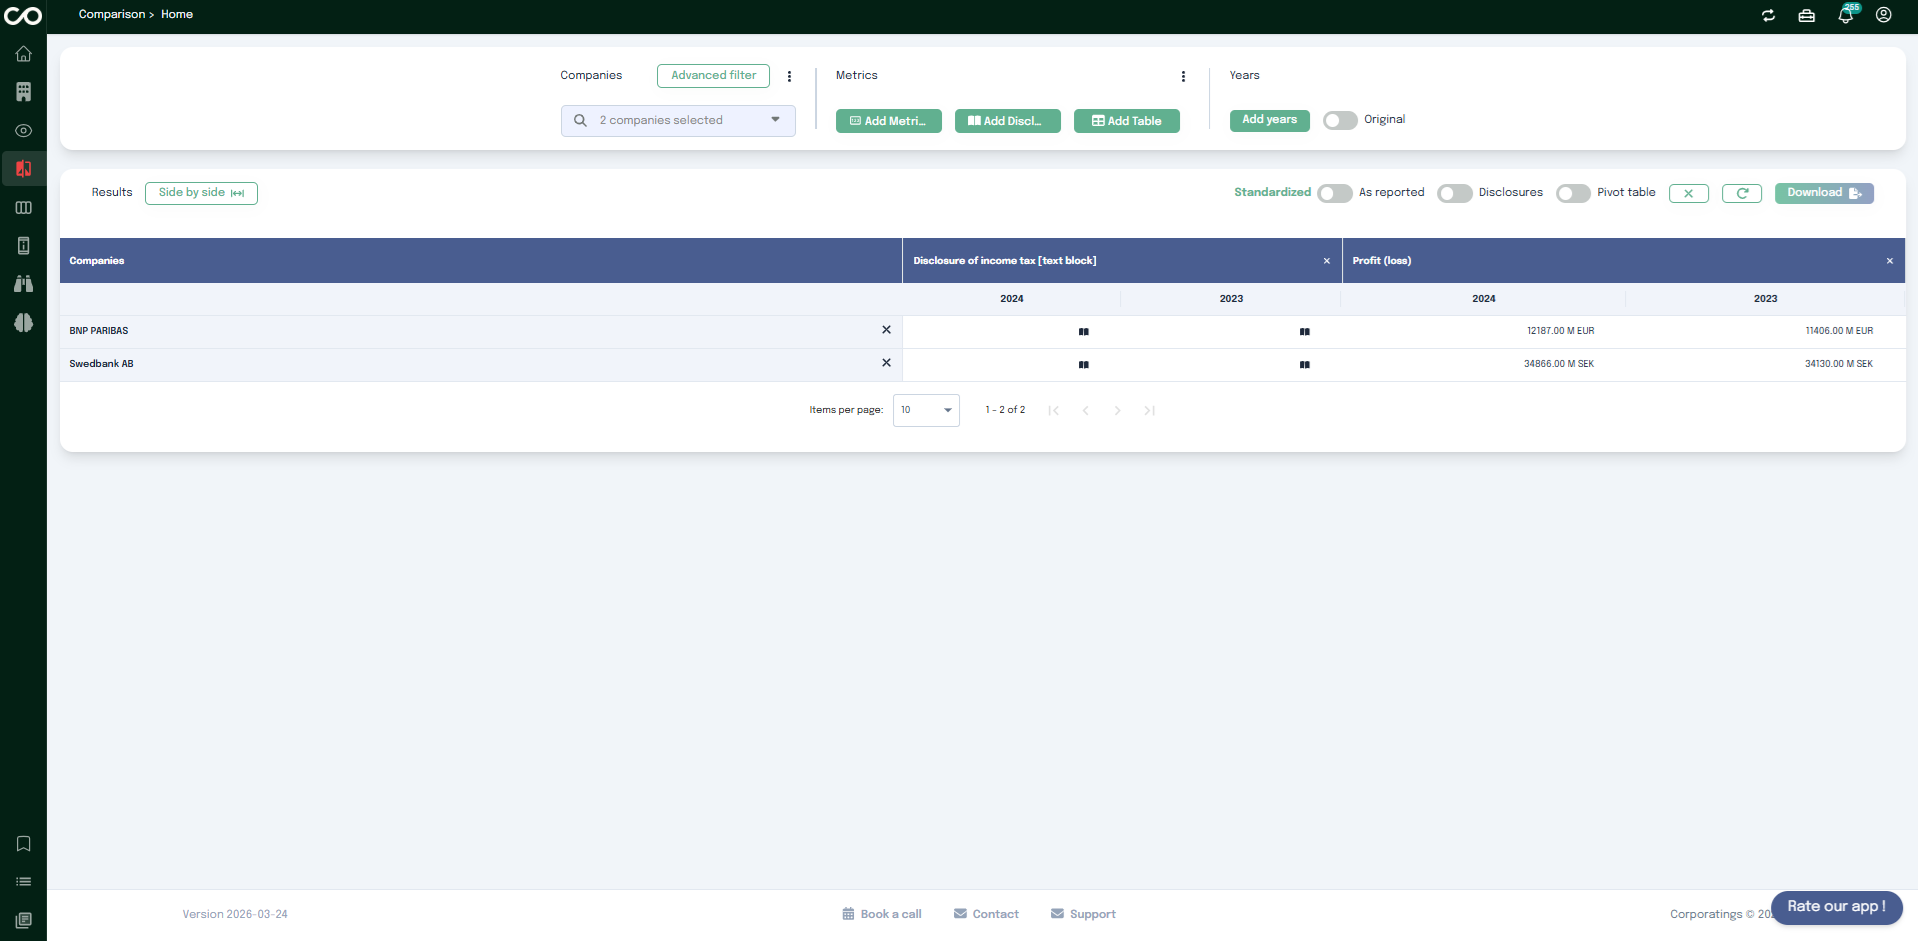
Step 2: Read and Interact with the Results
Once your scope is defined, results are displayed as a table: each row is a company, and each selected metric or disclosure appears as a column, broken down by year.
Above the table, a few controls let you adjust how results are displayed and managed:
Side by side : arrange the selected years next to each other for direct comparison.
Standardized / As reported : switch metric values between Corporatings' normalized definitions and the figures exactly as published by the company.
Disclosures : show or hide the disclosure columns in the results.
Pivot table : switch the results grid to a pivoted layout.
Clear (x) and Refresh : reset or reload the current results.
Every value in the table is interactive:
For disclosures, the cell shows an icon instead of the full text clicking it opens a modal with the complete disclosure text, where you can still use See in report to open the source report at the exact passage.
For metrics, clicking a figure opens the source report and scrolls directly to where that value is shown.
At the bottom of the table, use Items per page and the pagination controls to browse through the compared companies.
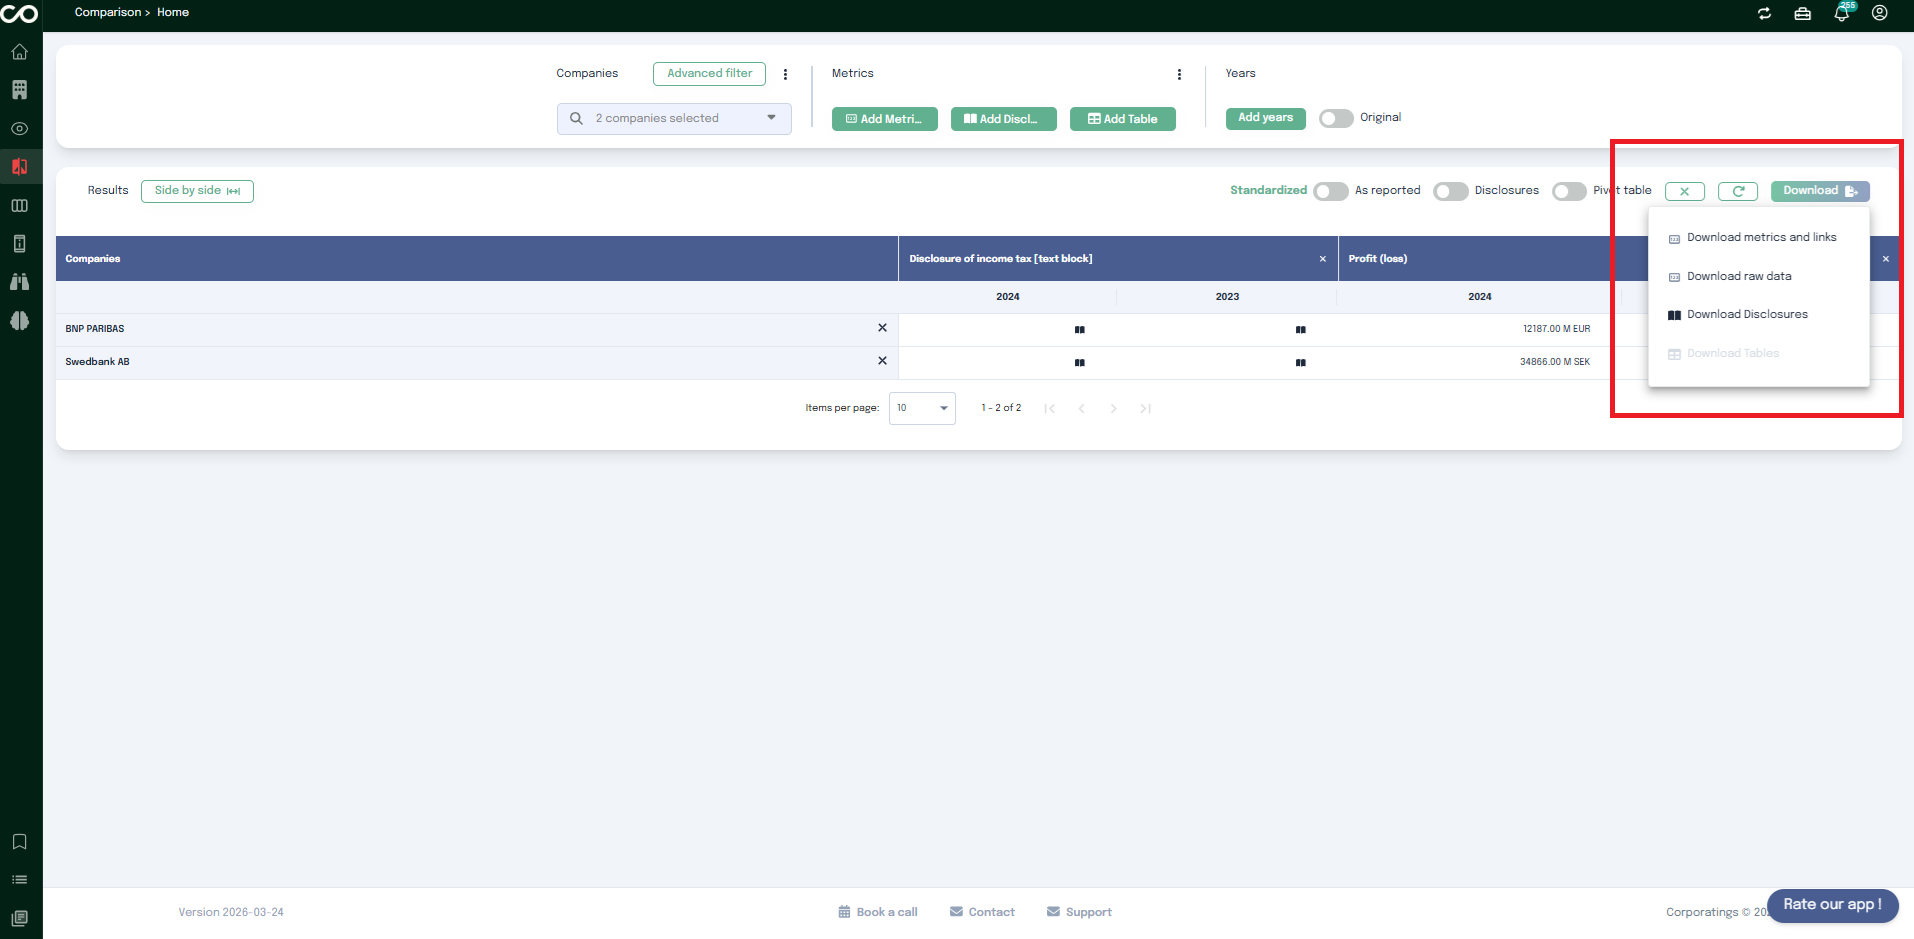
Step 3: Download the Results
Once your comparison is ready, click Download to export it for reuse outside the app. The dropdown offers several export options:
Download metrics and links : the selected metrics with direct links back to their source.
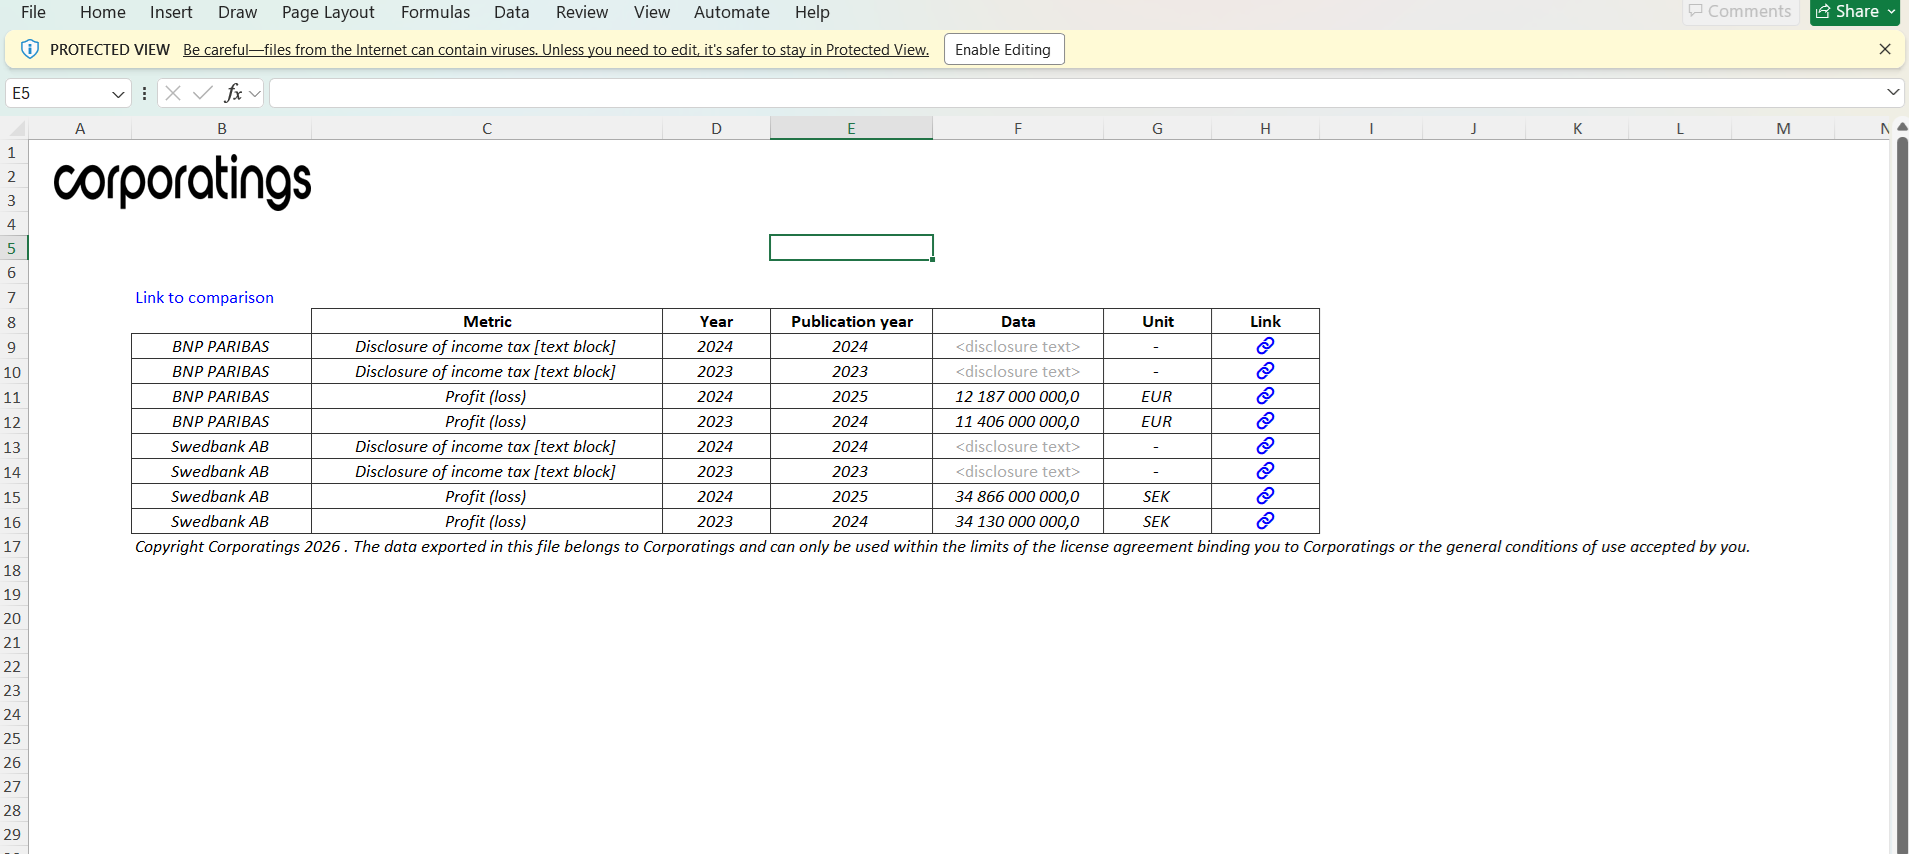
Download raw data : a spreadsheet with one row per company/metric/year, including the Metric, Year, Publication year, Data, Unit, and a Link back into the app for each row (plus a general link back to the comparison). For disclosure rows, the Data column shows a placeholder since the full text is not included use Download Disclosures to retrieve it.
Download Disclosures : the full text of the selected disclosures.
Download Tables : available only when your comparison includes one or more tables added via Add Table.
Benchmark
The Benchmark page provides detailed and qualitative comparisons on financial, extra-financial, and XBRL topics, allowing you to benchmark practices and performance across companies.
The page is organized into three tabs: XBRL, Financials, and Sustainability. When you first open the Benchmark page, you land on the XBRL tab by default.
XBRL Tab
The XBRL tab helps you explore how companies use XBRL metrics in their filings. It is divided into four sections:
Metric frequencies : Statistics on the use of metrics, their components, and the subtotals they contribute to. This feature is currently under development.
Mappings : Find which technical XBRL name is associated with a specific human-readable label.
Human labels : Find which human-readable labels are displayed for a specific technical metric name.
IFRS notes mapping : Find suggestions on how to tag text block contents. This feature is currently under development.
Mappings
The Mappings section lets you search by human-readable label to discover which technical XBRL names companies actually use for that concept.
Type a human label in the search bar for example, interest income. The results show:
The most commonly used technical name across companies, for instance: RevenueFromInterest.
All other technical names mapped to the same label, ranked by frequency of use.
The list of companies that have used each technical name, so you can trace real-world usage across filings.
This is particularly useful when you want to verify naming consistency across filings or identify tagging discrepancies between companies.
Human Labels
The Human Labels section works in the opposite direction: you enter a technical XBRL name to find the human-readable labels companies associate with that metric.
Type a technical name in the search bar to see all the labels that have been used for it across different filings, along with the companies using each variant.
Financials Tab
The Financials tab gives you access to specific financial benchmarks extracted from company filings. It is organized into six sections:
WACC
Identify the cash-generating units (CGUs) mentioned in filings, along with the weighted average cost of capital (WACC) and growth rates used for impairment projections. This lets you compare valuation assumptions across companies and assess the consistency of their inputs.
Useful Life
View and compare depreciation periods for all asset types across companies. This section helps you understand how organizations set the useful life for both tangible and intangible assets, enabling benchmarking of amortization and depreciation policies.
Pension : Actuarial Assumptions
Extract and compare the key actuarial assumptions used in pension valuations, including the discount rate and the salary growth rate. Comparing these assumptions across companies can reveal significant differences in pension liability estimates.
Goodwill
Collect goodwill-related metrics such as impairment amounts and ratios. This section also identifies the cash-generating units subject to goodwill impairment and surfaces the reasons companies disclose for recognizing that depreciation, making cross-company analysis more actionable.
Share-Based Payment : Plan Description
Retrieve all share-based payment plans disclosed by each company. This section gives you a structured overview of the plans in place and helps you compare compensation structures across companies.
Purchase Price Allocation
Identify the assets recognized and the prices allocated for each acquisition. This section surfaces the breakdown disclosed by companies following business combinations, making it easier to compare acquisition accounting across deals and entities.
Disclosures
The Disclosures page lets you search for specific content across one or several companies at once, using either a keyword search or a natural-language AI search.
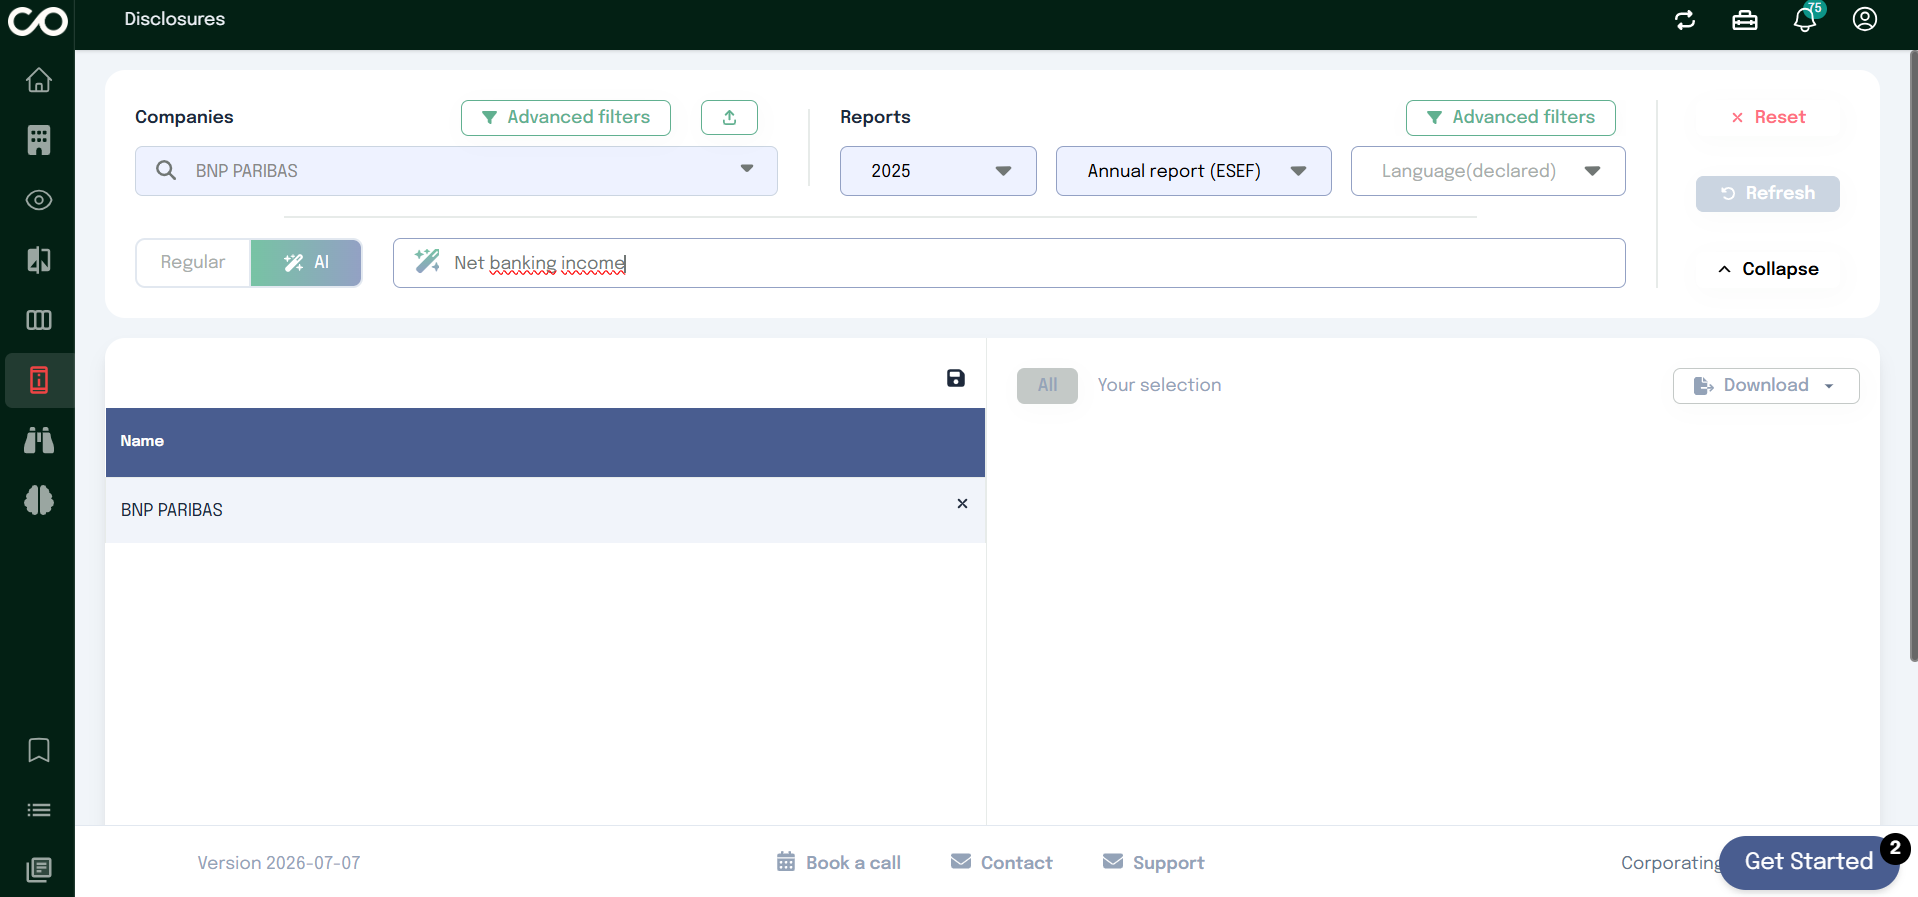
Step 1: Select Companies and Reports
Start by searching for one or more companies in the Companies field. Each company you add appears in the list below, and you can remove one at any time by clicking the x next to its name.
Then define the scope of the reports to search in the Reports filters:
Year : the reporting year to search in (e.g. 2025)
Report type : the type of document to search (e.g. Annual report (ESEF))
Language (declared) : optional the report's language is detected automatically, but you can filter on it if needed
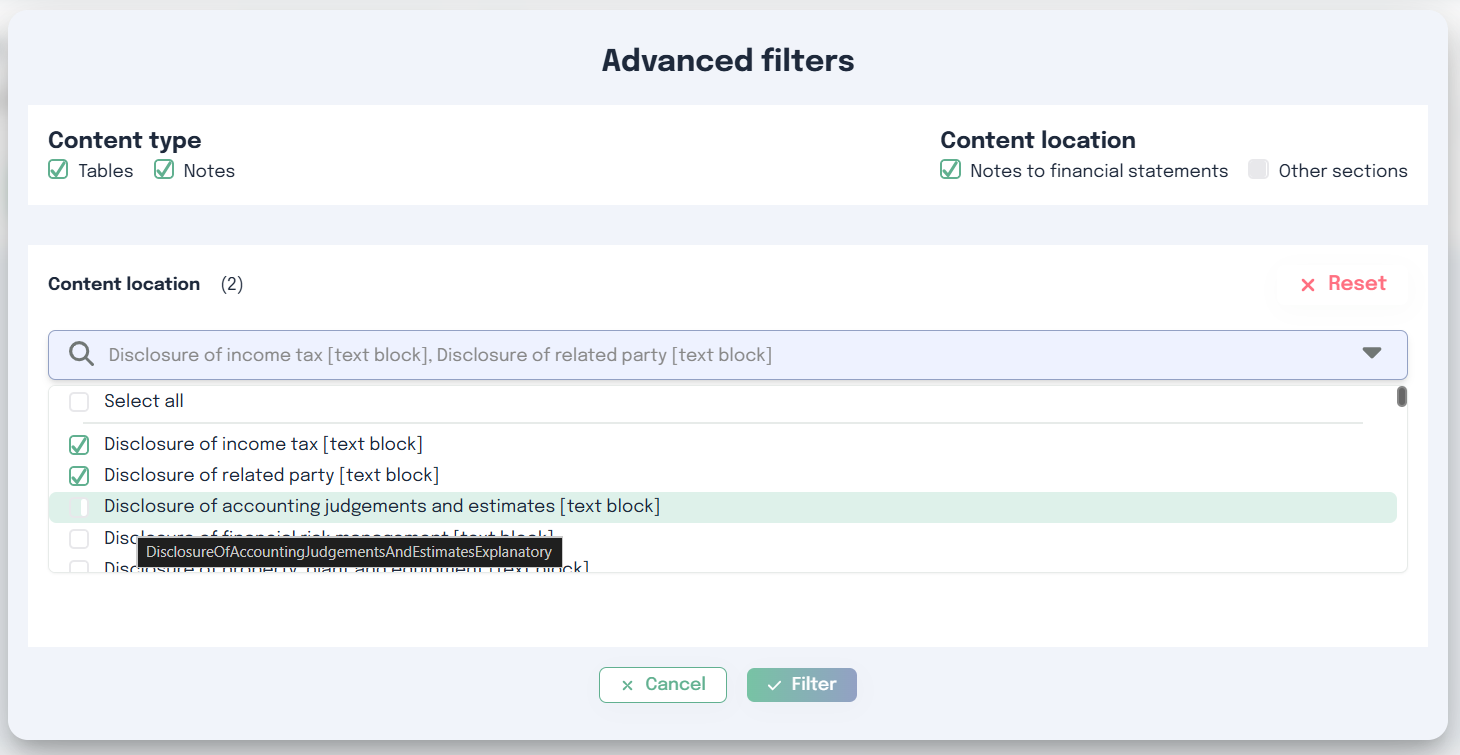
Step 2: Refine with Advanced Filters
Both the Companies and Reports panels have their own Advanced filters. On the Reports side, Advanced filters let you narrow the search down to specific disclosures before running your query:
Content type : restrict the search to Tables, Notes, or both
Content location : restrict the search to content located in the Notes to financial statements, in other sections of the report, or both
Content location list : select one or more specific disclosures (e.g. Disclosure of income tax, Disclosure of related party) to search within
Click Filter to apply your selection, or Reset to clear it.
Step 3: Search with Keywords or AI
Once your companies and reports are set, use the search bar to look for content. Two modes are available:
Regular : a classic keyword search
AI : a natural-language search. Type what you are looking for for example Net banking income and press Enter.
The application then scans the selected reports for the chosen year and returns every passage matching your query.
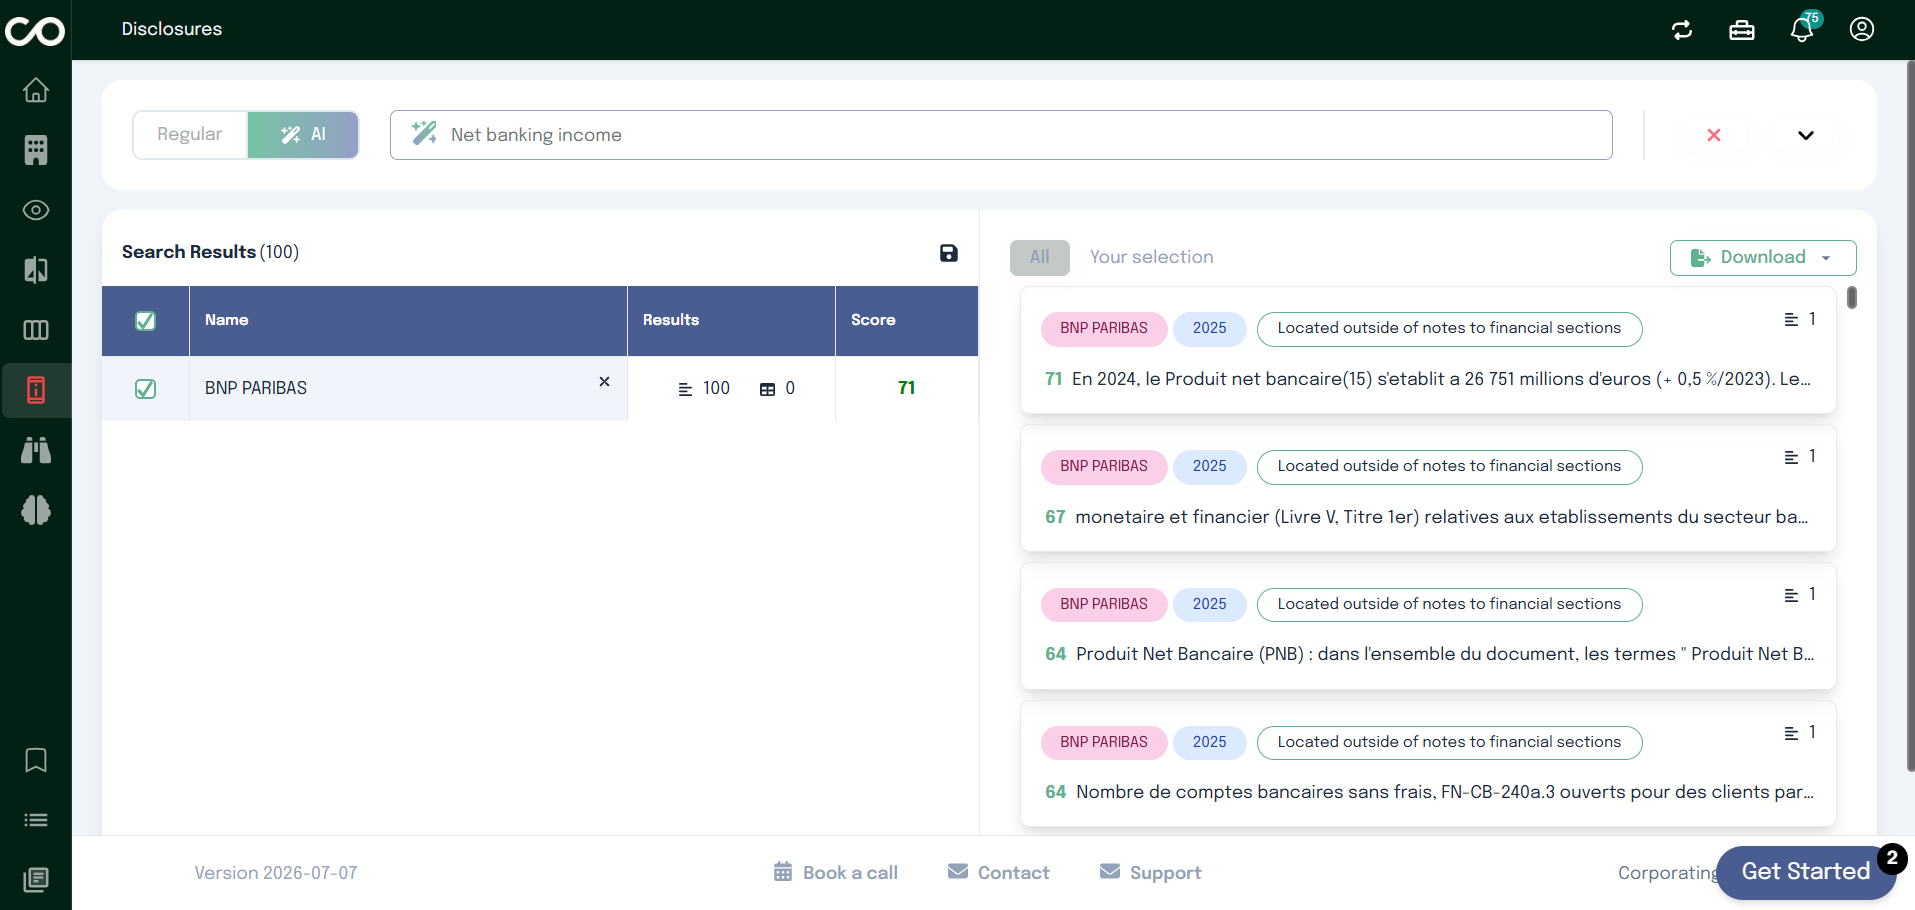
Step 4: Browse the Results
Results are displayed in two panels:
On the left, a table lists each company with its number of results and a relevance Score.
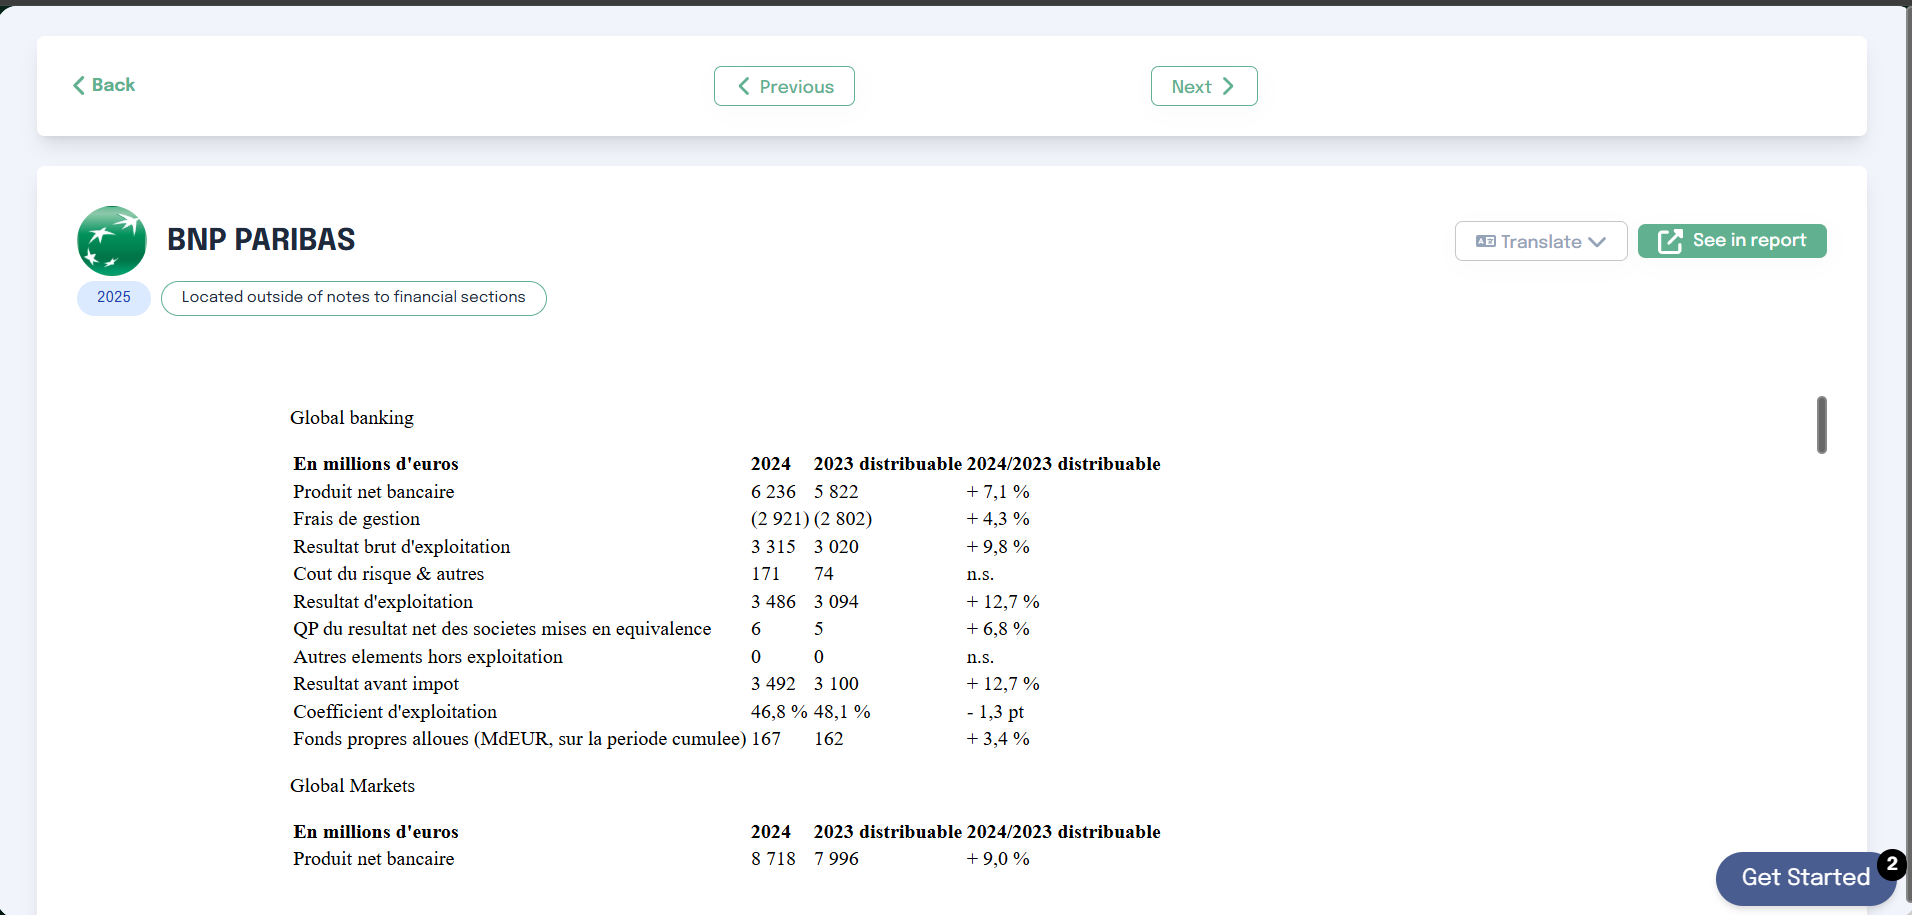
On the right, every matching excerpt is listed with its own score, tagged with the company, the year, and its location in the report (e.g. Located outside of notes to financial sections).
You can check or uncheck companies to control what appears in the Your selection view, and use the Download button to export the results.
Step 5: Open an Excerpt in Context
Clicking on a result opens a modal with the full excerpt where your search term appears.
From this modal you can:
Translate : display the excerpt in the language you prefer
See in report : open the original report and jump directly to the exact location where the excerpt appears
Use Previous and Next to move between results without closing the modal.
AI Sandbox
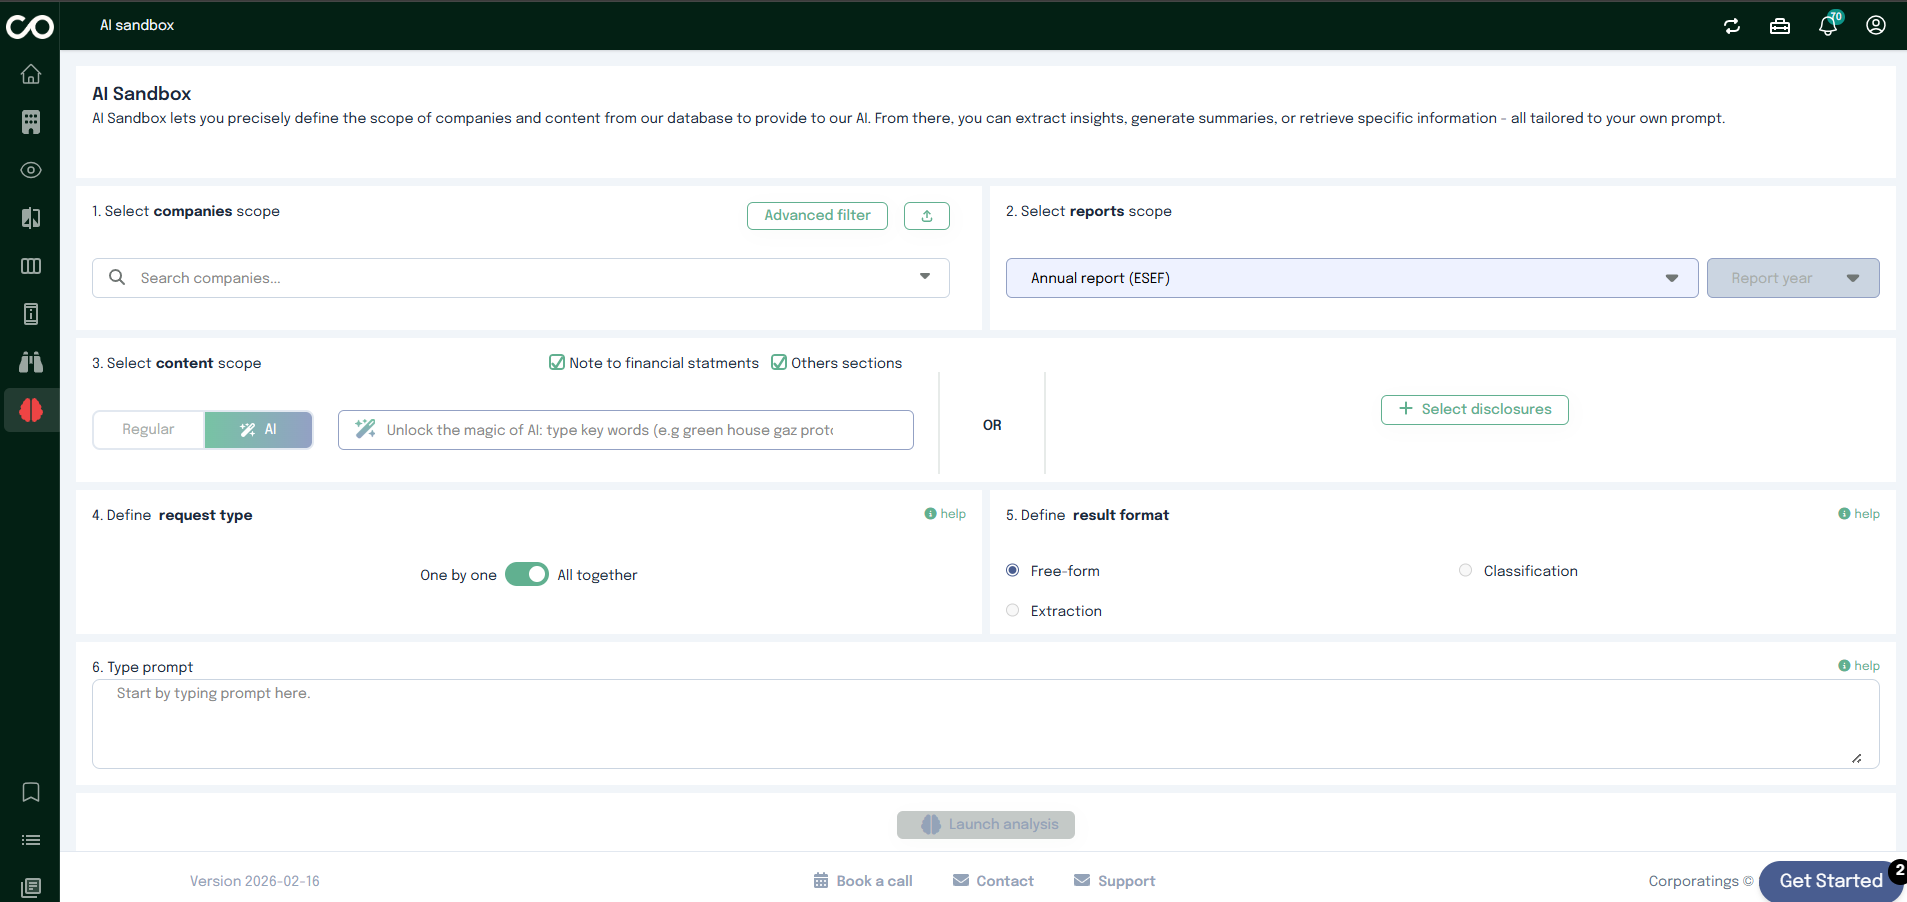
Overview
The AI Sandbox allows you to precisely control which companies and content are shared with the AI. By defining scopes,
request types, and output formats, you can extract insights, generate summaries, or retrieve structured information
all driven by your own prompt.
This guide walks you step by step through a typical workflow in the AI Sandbox.
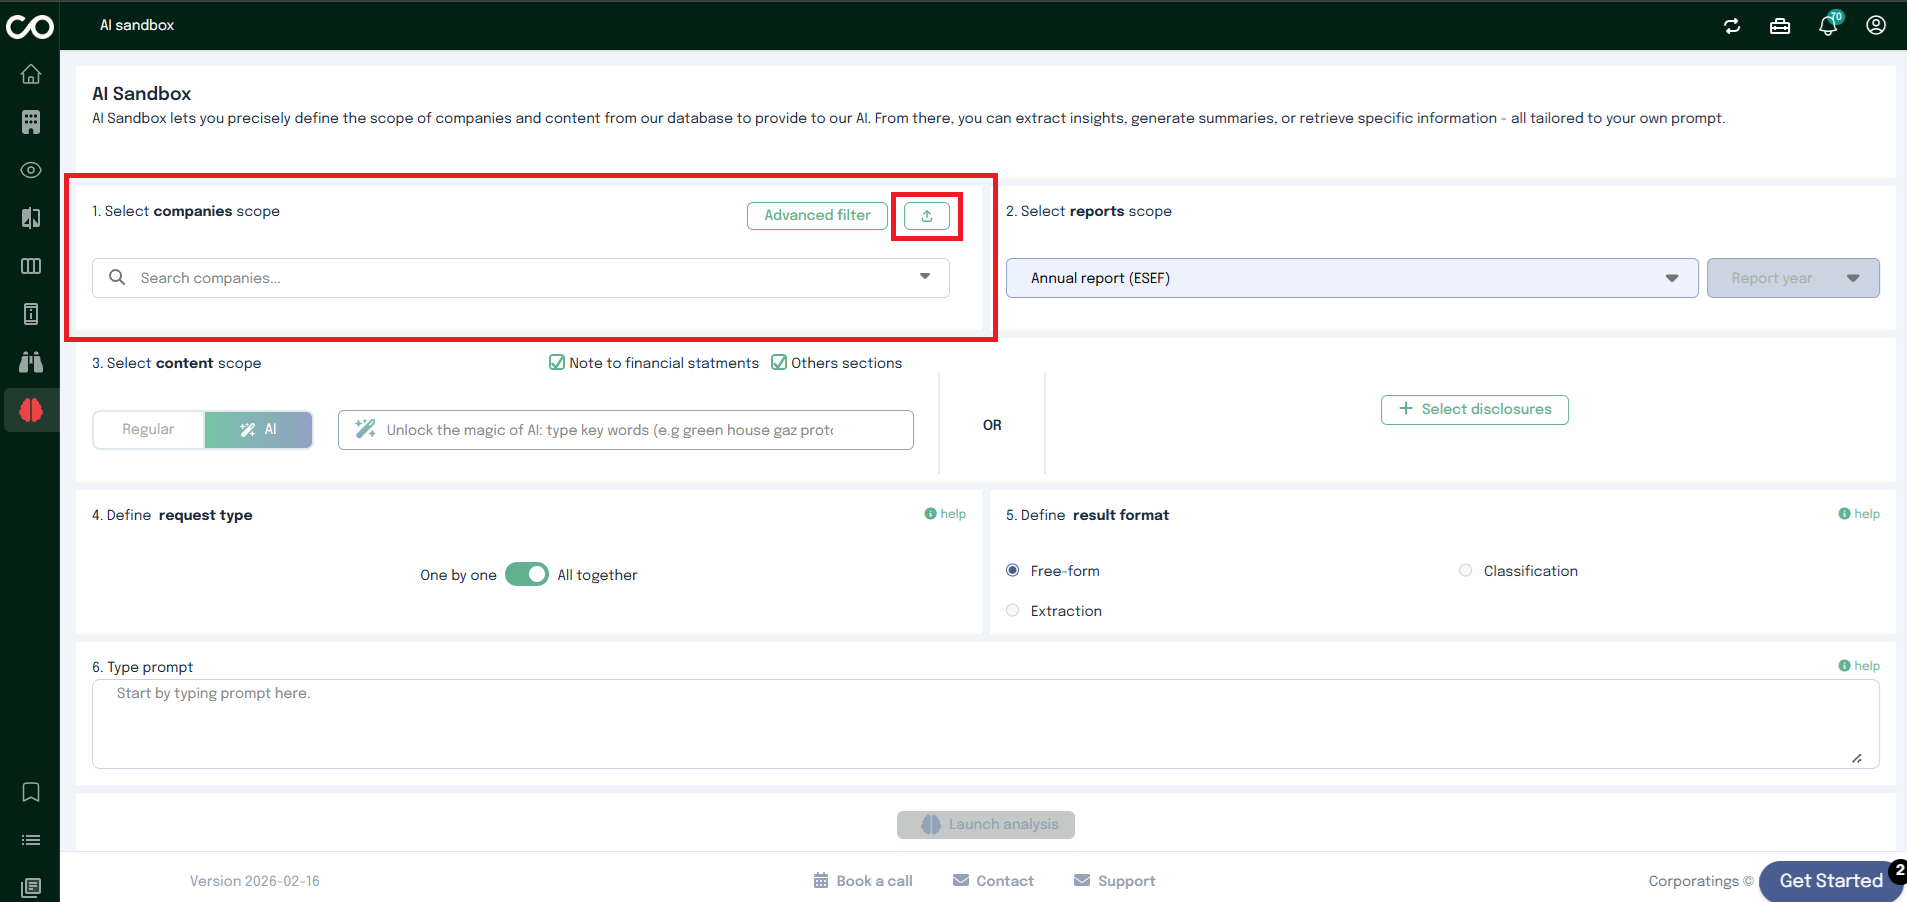
Step 1: Select Companies
Once you land on the AI Sandbox page, start by selecting the companies you want to analyze.
You can choose companies in two ways:
Using the dropdown list to manually select one or multiple companies.
Selecting a predefined company list by clicking the dedicated icon.
You can select one or several companies depending on your analysis needs.
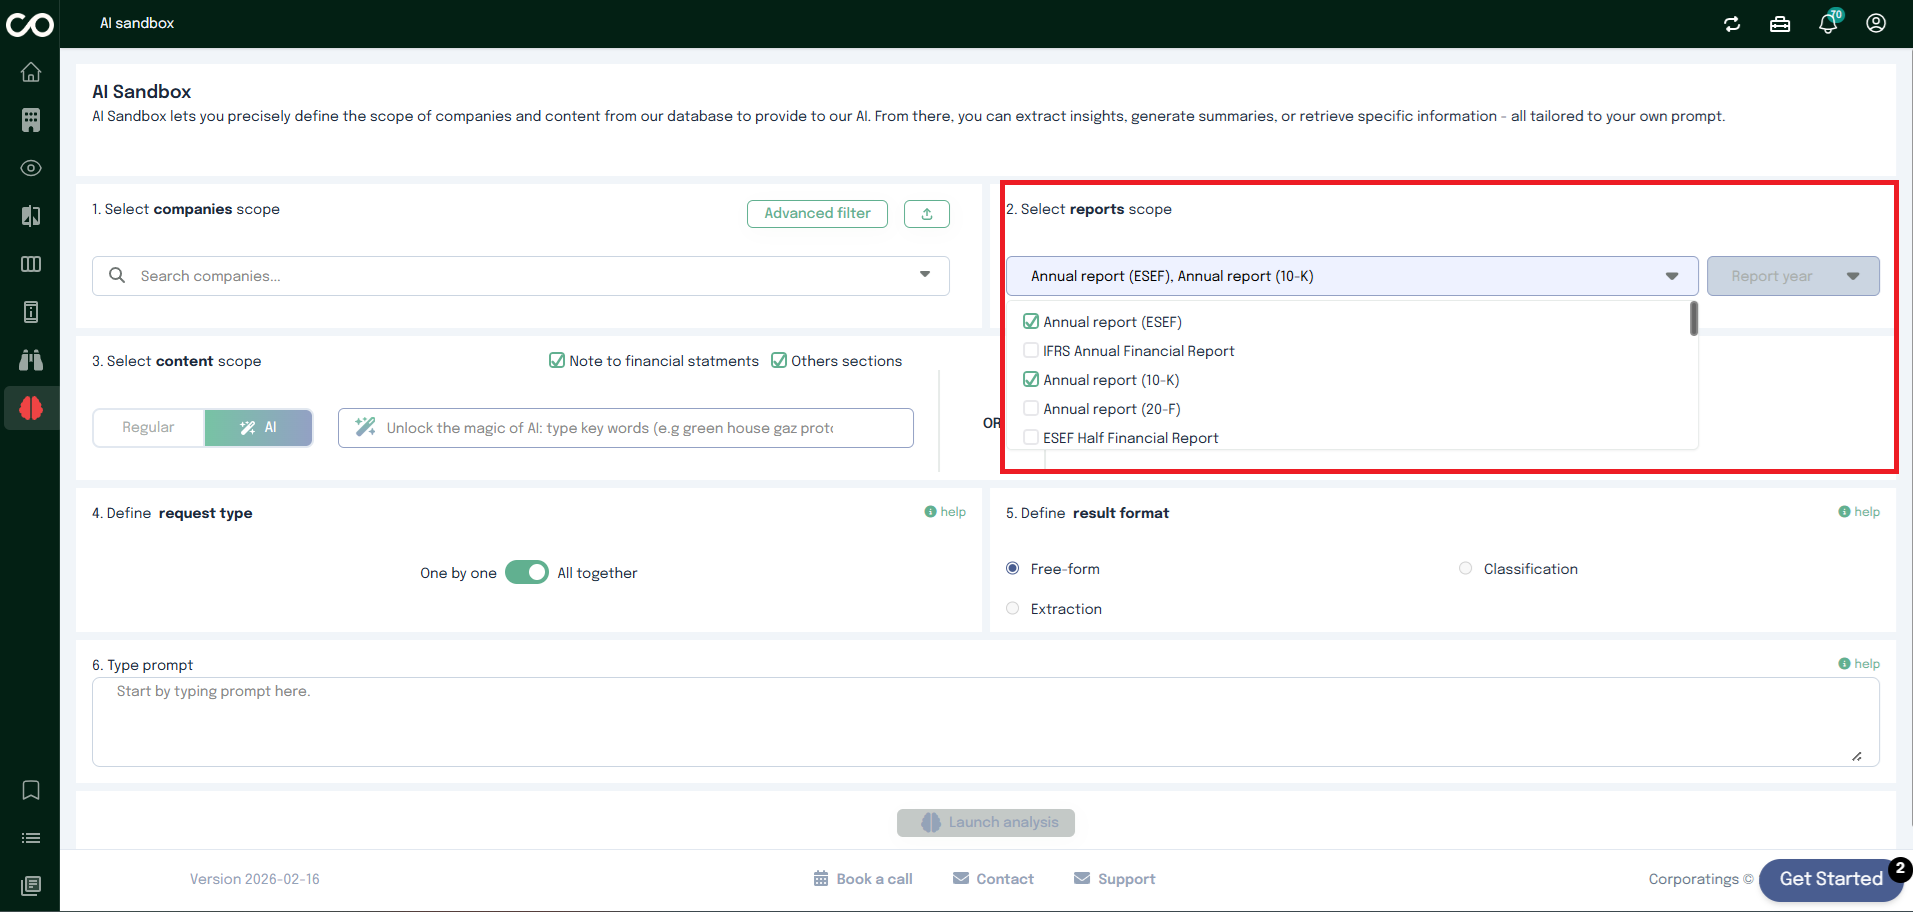
Step 2: Define the Report Scope
Next, choose the Report Scope using the dropdown menu.
This step defines which reports or documents from the selected companies will be included in the analysis.
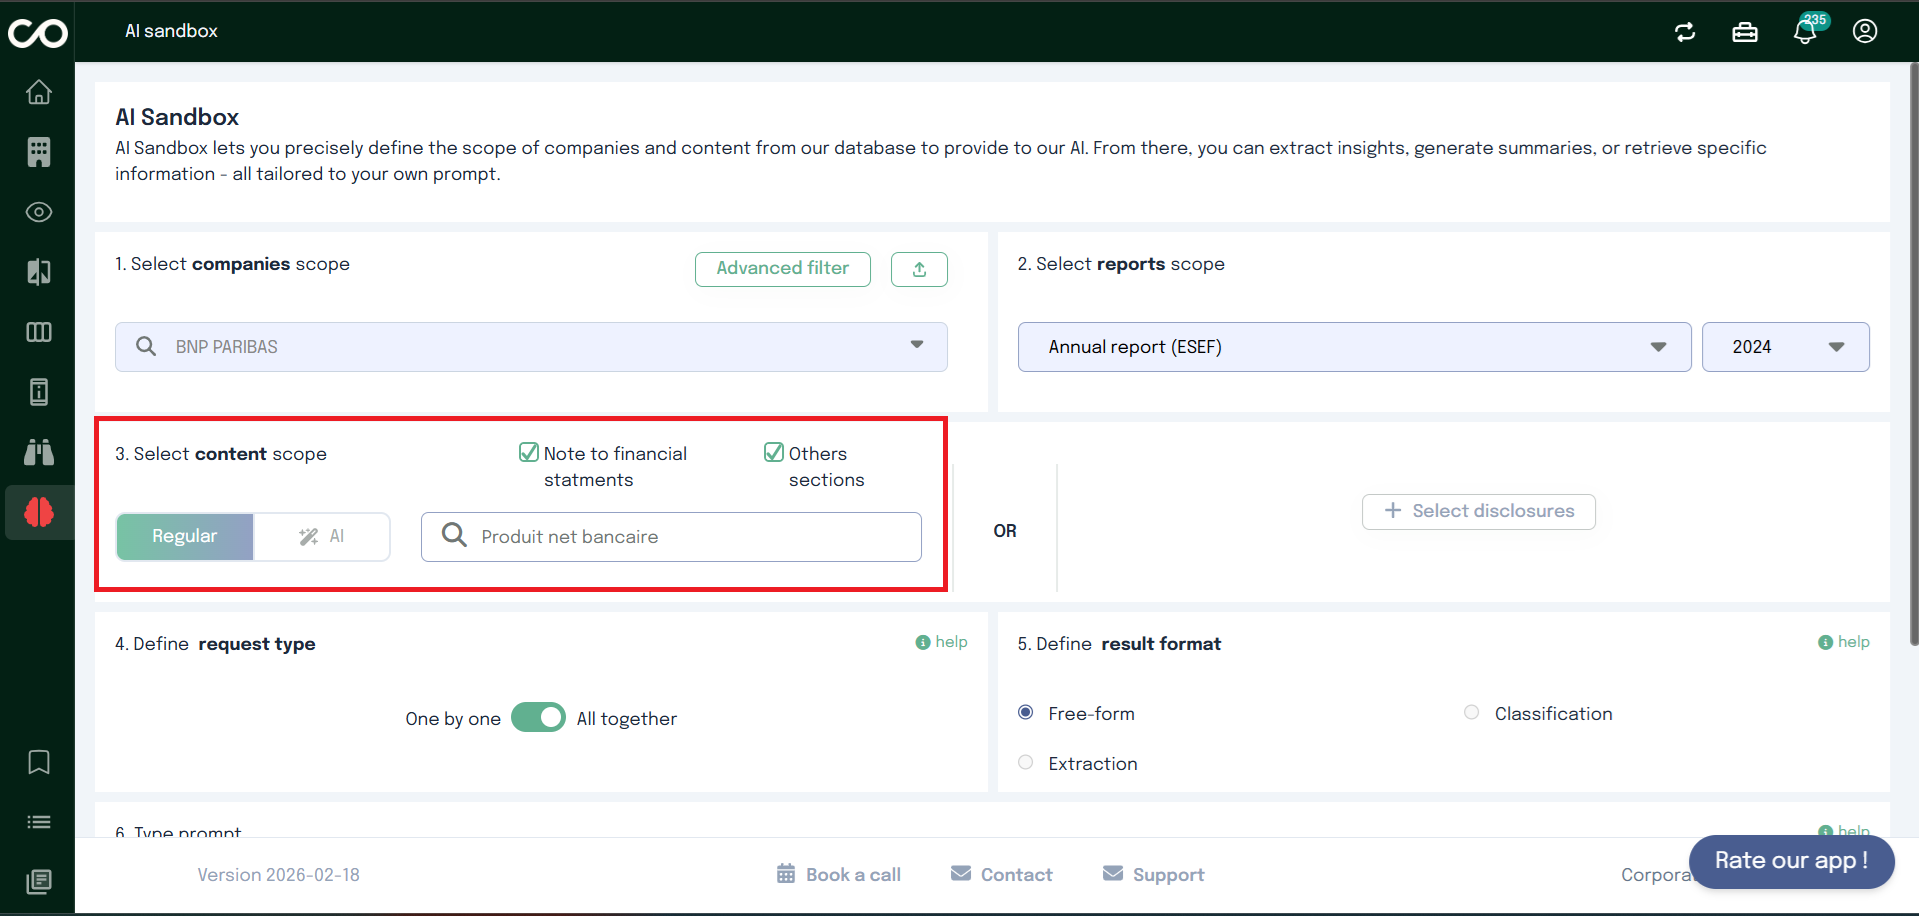
Step 3: Select Content Scope
Option A – Content Search
You now define what type of content the AI should analyze.
You can choose between:
Regular search
Enter a specific keyword to search within the selected document.
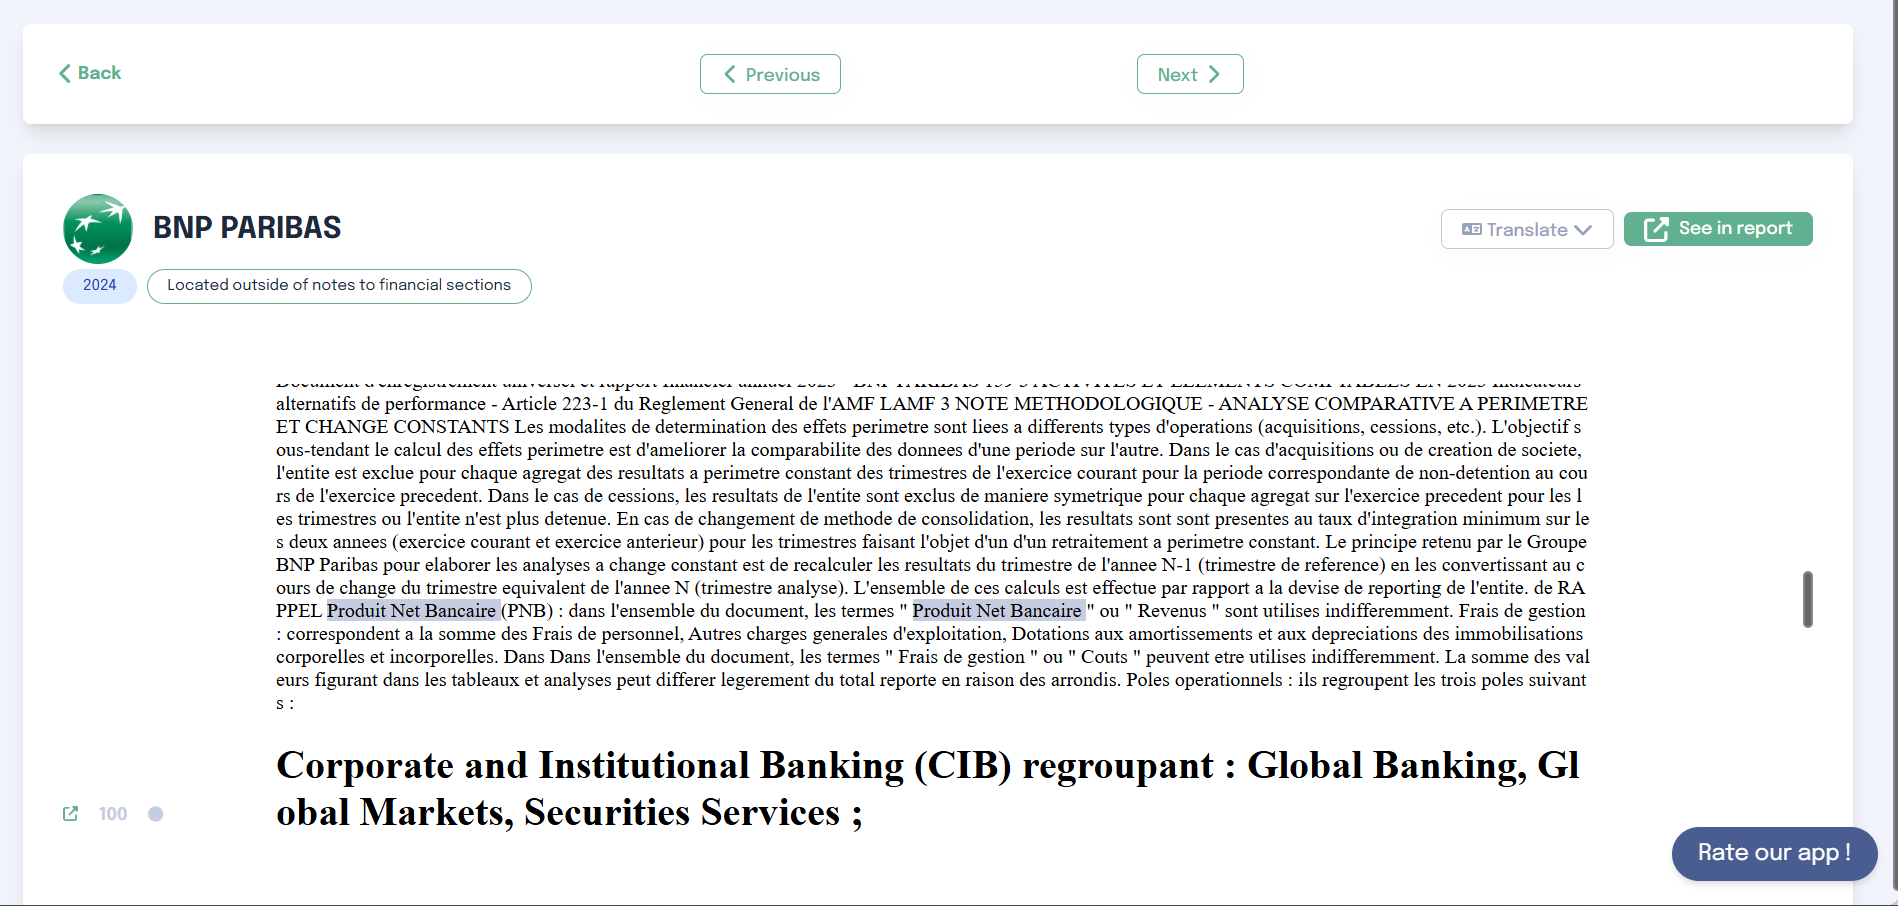
When a user initiates a search:
The system scans all relevant documents from our database of 50,000+ reports, based on the filters applied
(by default, or by the user).
Matches are located within fragments (also called chunks), which are sections of text or tables.
A highlighting mechanism visually indicates the occurrences of the search term within each fragment.
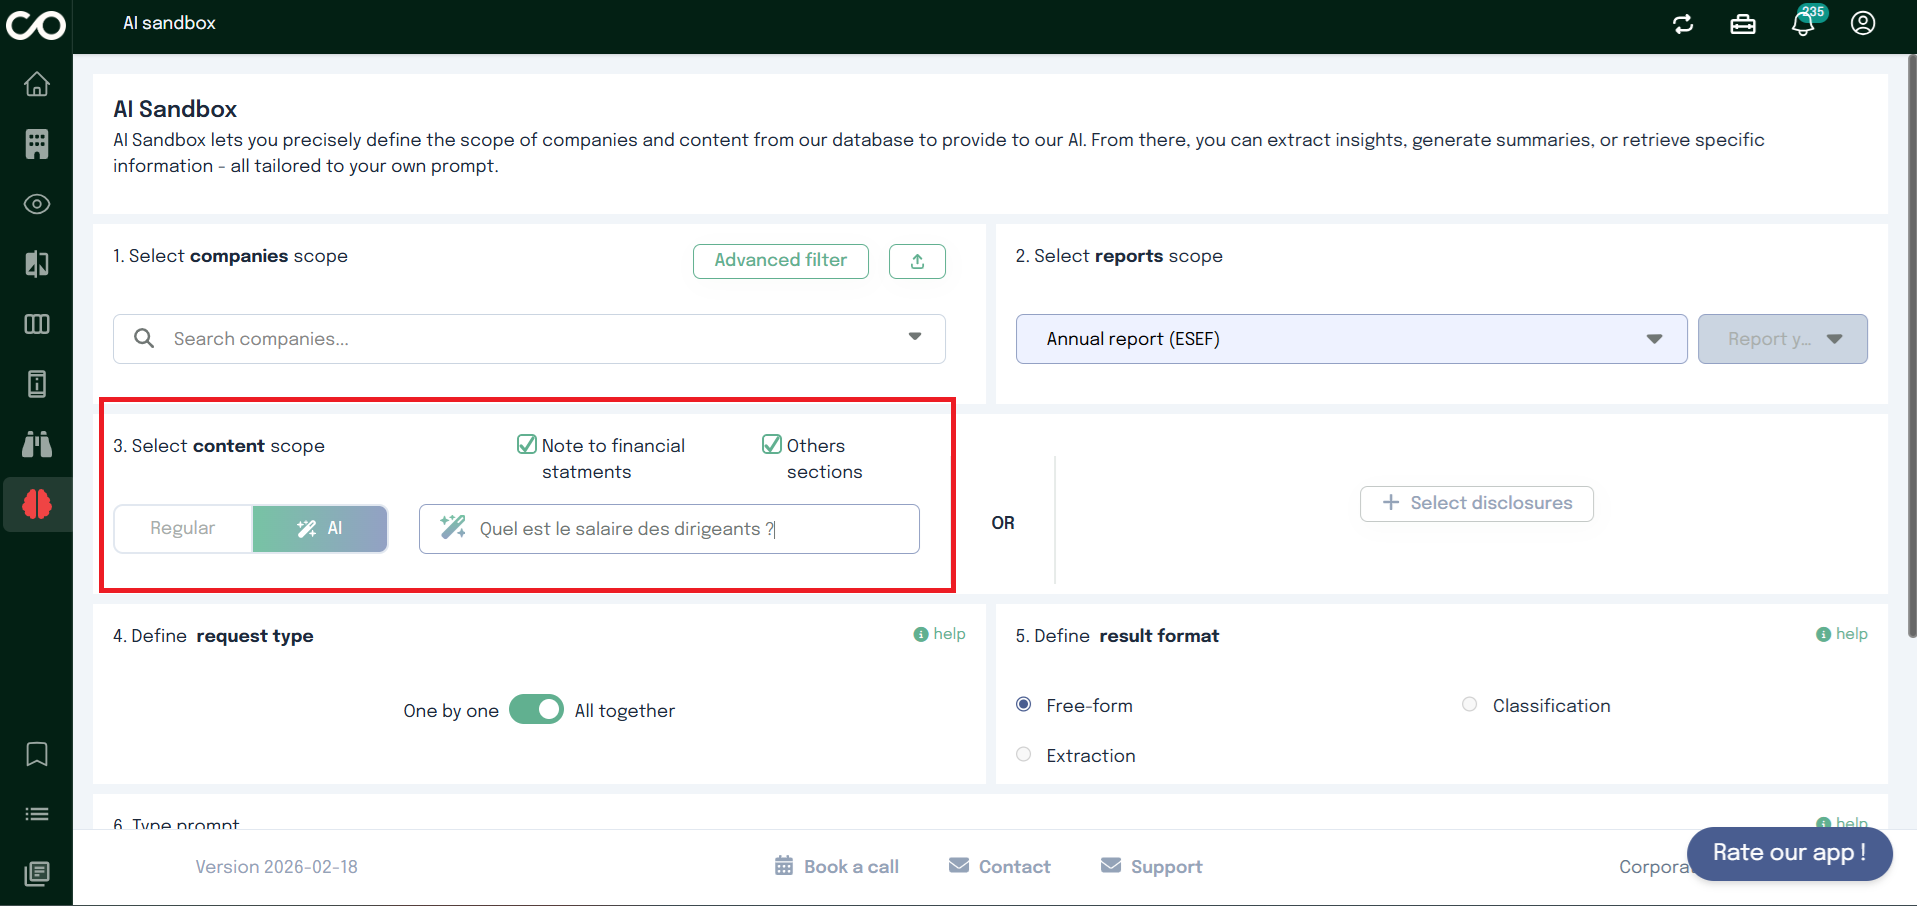
AI search
Describe in natural language what you are looking for. The AI will retrieve the most relevant data based on your
description. Unlike traditional keyword-based search, semantic search aims to understand the meaning behind a
query and relies on natural language processing (NLP) and deep learning.
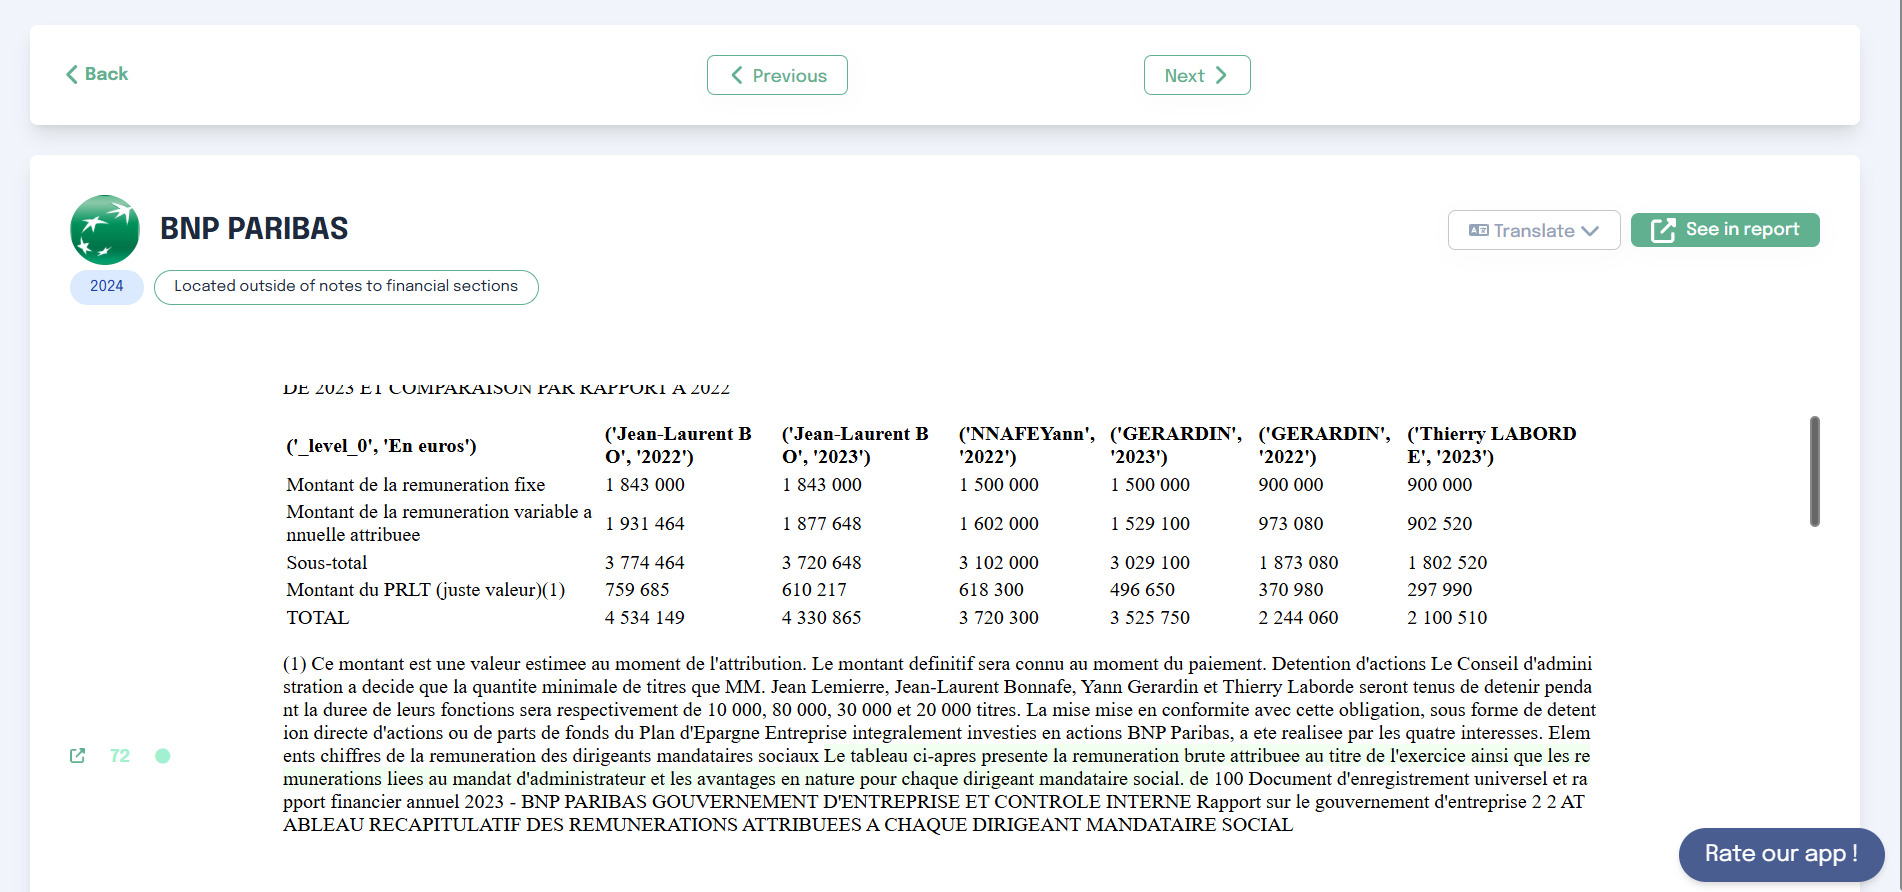
Initial Search in the Database
The user enters a query (e.g., greenhouse gas). The semantic search engine analyses the query and compares it to
all reports in the database.
By default, filters (year, report type) are applied, and only matching documents are considered. Users can
modify these filters and add other ones depending on the analysis.
The algorithm selects the top 300 results based on semantic relevance
Once results are retrieved, they are grouped by company
Each company may have multiple relevant fragments (results)
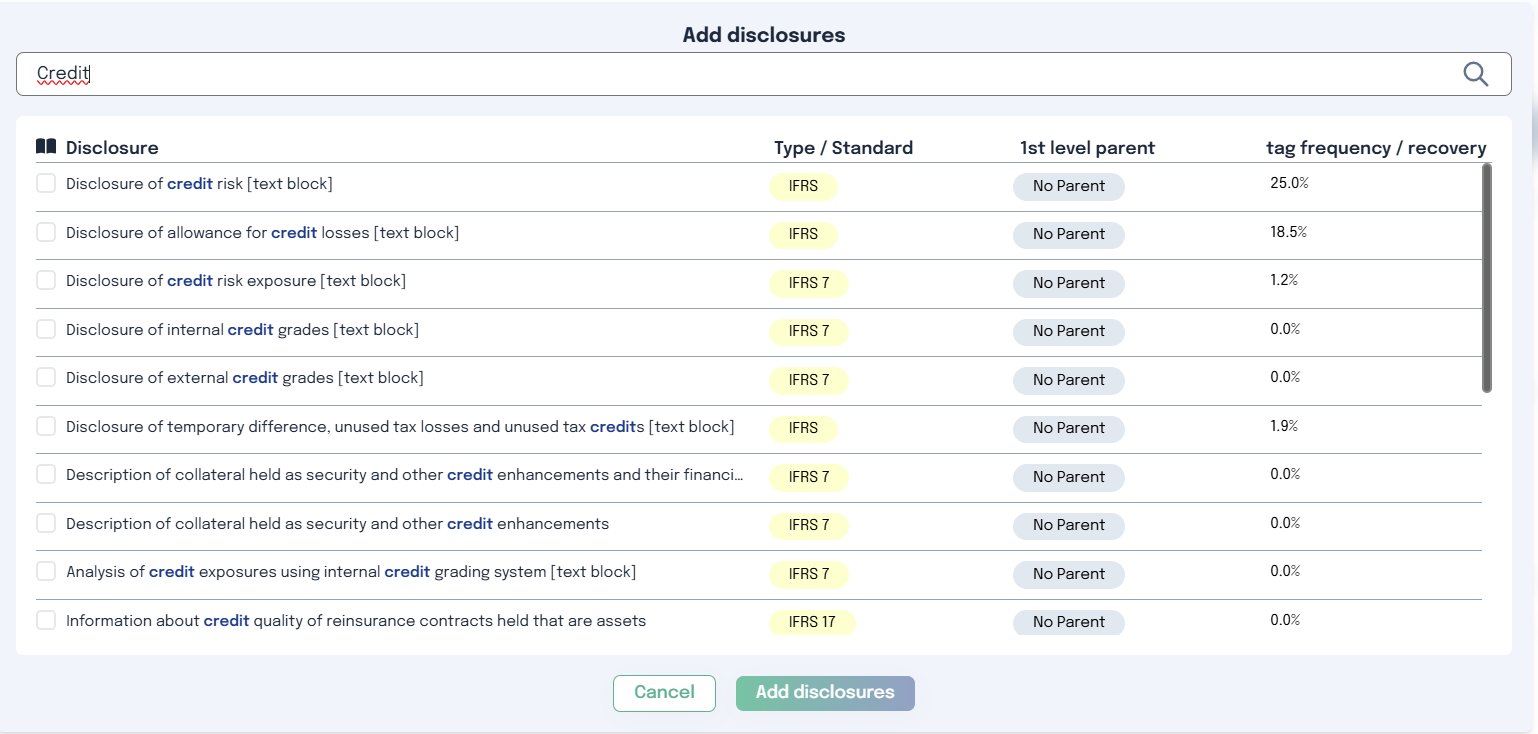
Option B – Select Disclosures
Alternatively, you can manually select specific disclosures:
Click “Select disclosures”
Search and select the metrics you want the AI to analyze
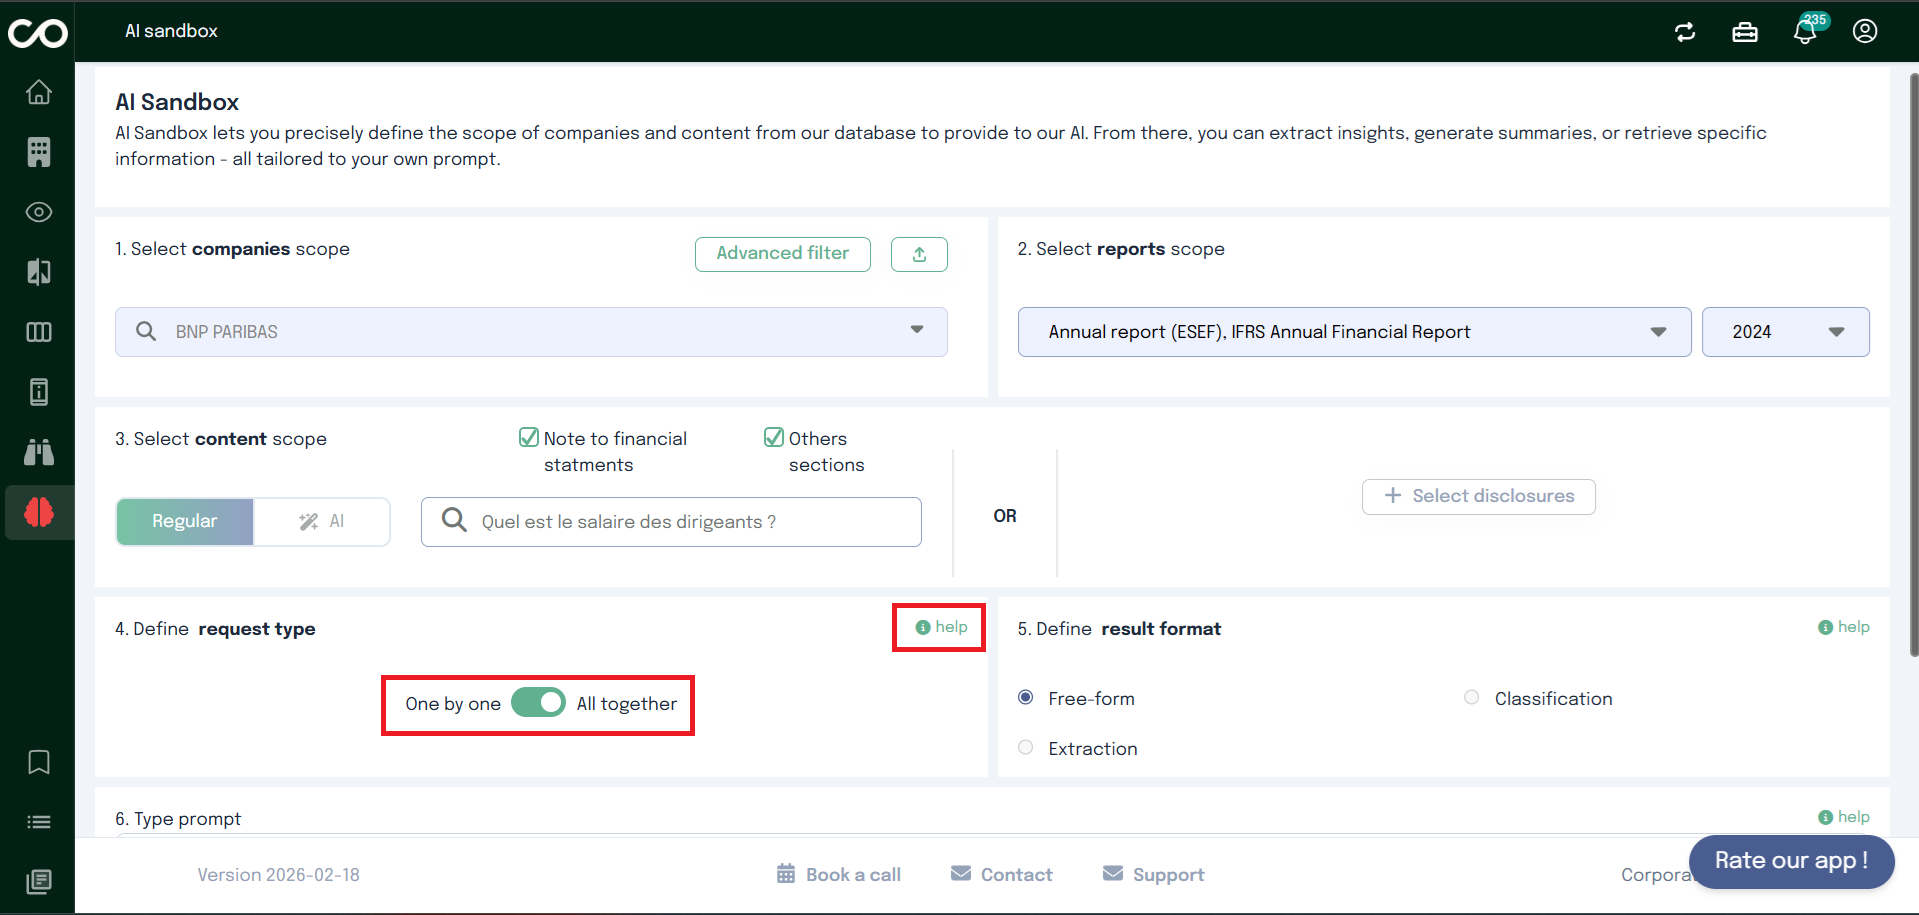
Step 4: Define the request type
Choose how the AI should process the companies content using the switch button:
One by One : each company is analyzed individually, independently of the others.
Best used when:
Extracting specific information per company
Classifying companies
Generating company-level insights
All Together : all selected companies content is analyzed.
Best used when:
Identifying global trends
Performing cross-company comparisons
Generating collective insights
Click the help icon for a detailed explanation directly in the interface.
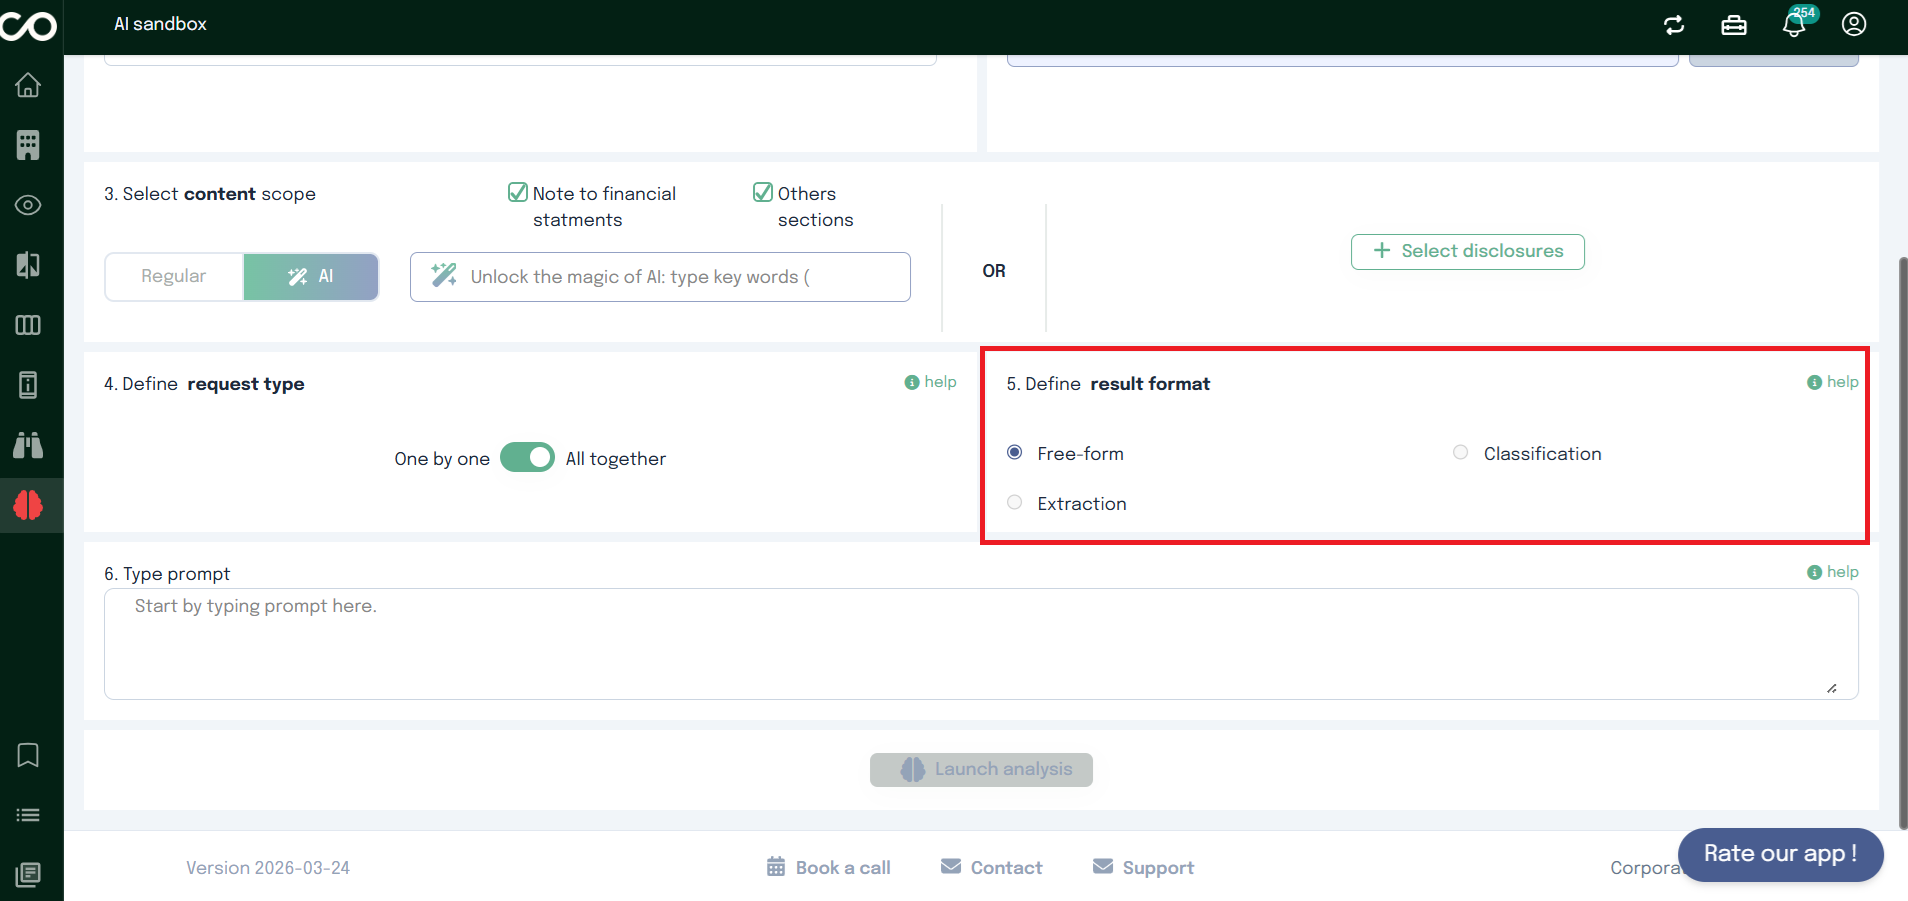
Step 5: Define the result format
Select how the AI should structure its output.
Available format
Free-form
Unstructured text output.
Used for :
Explanations
Summaries
Cross-entity comparisons
Interpretative analysis
Extraction
Structured data output.
Used for :
Names, dates, figures, keywords
Table-ready data
Reusable datasets
Classification
Categorization into predefined labels.
Used for :
Tagging
Pattern detection
Sorting/filtering at scale
Dependency with Request Type
The available formats depend on the selected Request Type.
Request Type: All together
Scope: all companies analyzed as a single dataset
Objective: global insights, comparisons, patterns
Available formats
Only Free-form is allowed
Request Type: One by One
Scope: each company processed independently
Objective: per-entity outputs
Available formats
Extraction
Classification
Detailed explanations are available via the help icon.
Step 6: Type your prompt
Type your prompt to instruct the AI on how to process the selected content.
Your prompt should clearly specify:
What information you want
How it should be analyzed
Any constraints or formatting expectations
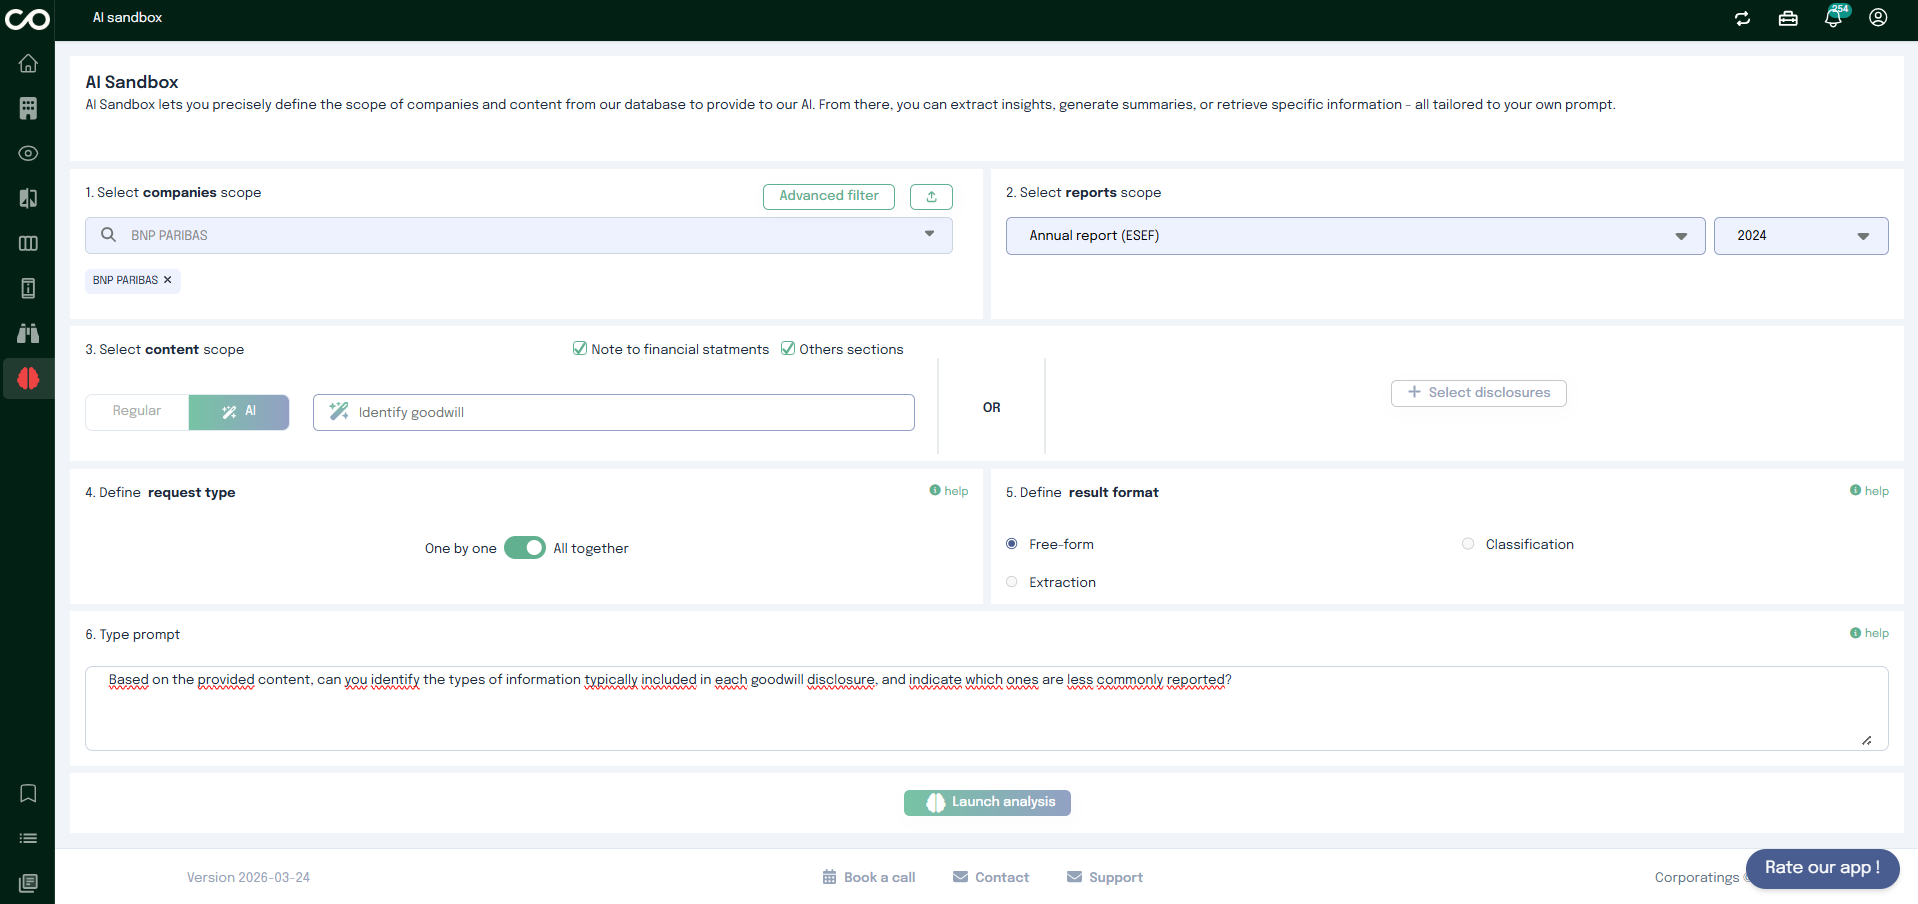
Prompt examples
Synthesis (All together / Free-form)
Based on the provided content, can you identify the types of information typically included in each goodwill disclosure, and indicate which ones are less commonly reported?
Data Extraction (One by one / Extraction)
Here are excerpts from URD containing information about employees. Please extract the following information about the entity's employees:
The total number of employees for the most recent reporting year available in the document.
Ensure that the data is for the most recent year mentioned in the document (e.g., use 2024 rather than 2023).
The unit used must be clearly indicated as “employees”.
Classification (One by one / Classification)
I provide content from URD mentioning information about the different categories of systemically important banks. Based on this content, determine whether the entity belongs to any of the following classes:
G-SIBs (Global Systemically Important Banks)
D-SIBs (Domestic Systemically Important Banks)
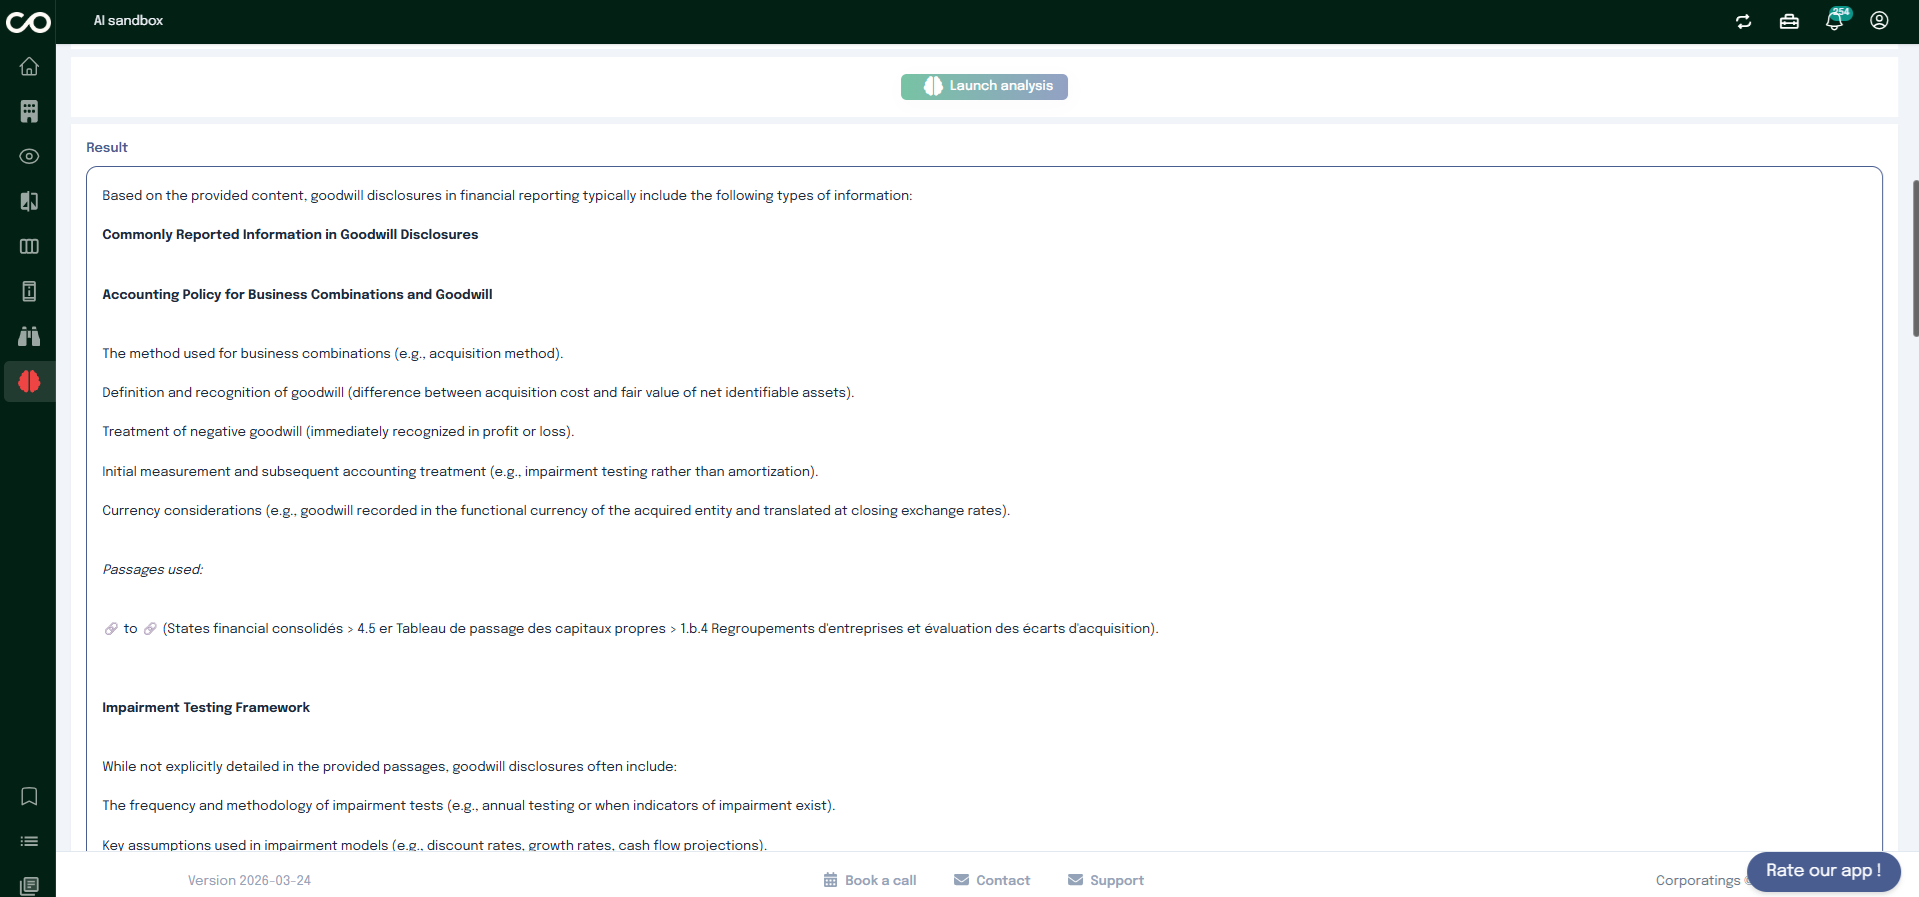
Step 7 : Run the Analysis
Once everything is set:
Click the final action button
The AI will process your request based on the selected scope, configuration, and prompt
Results will be displayed according to the chosen request type and result format.
Search
From here you can search these documents. Enter
your search terms below.